


Fractions
Imagine a fraction. Does it raise the hair on the back of your neck? Visualizing fractions makes them easier to understand. Invent visualizations of fractions and Inspire others to understand fractions more deeply.
In this project we use:
text, sector, viewer, Sector's angle, Sector's radius, Text's numeric value, variable
The Project
Begin by downloading the project from http://etoysillinois.org/library?sl=2143.
The focus of this project is visualizing fractions. The sector object allows creation of a slice of pie that represents any fraction of the pie desired. On page 2 of the book you click the sector tool at the upper left to create a slice of pie. Then check the "sector" category in the sector's viewer to change the angle and radius of the slice (see help at the upper left to review the Viewer under Halo). After visualizing fractions with the sector tool, students move on to page 3 for the invention part of the project. They should create fractions using the text tool from the supplies bin. They may just write the fractions in a single text box, but they will realize later that, to program, they must really have two text boxes, one for the numerator and one for the denominator.
On page 4 the students are asked to create a script that shows a visualization for any fraction they enter into a numerator and denominator of the fractions shown. There are many ways to do this. They should work on page 5. There is a solution on page 6, but don't have your students look until they have made a good attempt. They may struggle with this, but they will be learning.
On page 6 there is one solution to the task. Enter any numbers into the numerator and denominator of the fraction to see its visualization. Keep the fraction less than 1. Why? Discuss with them why the fraction must be less than 1. The maximum fraction the sector object can visualize is the whole circle and that represents 1. After students have written their own scripts they should compare them. Finally, your students should open a Viewer on the sector object and drag out my script. Have your students group and try to understand my solution. Then they should compare their solutions with mine.

NOTES:
The numerator and denominator are text objects. They can have variables of type numeric. The script gets the numerator and denominator needed to create a fraction. The fraction of 360 degrees (value 1 for the whole of the pie) is visualized by the sector object. The sector is a visualization of the fraction.
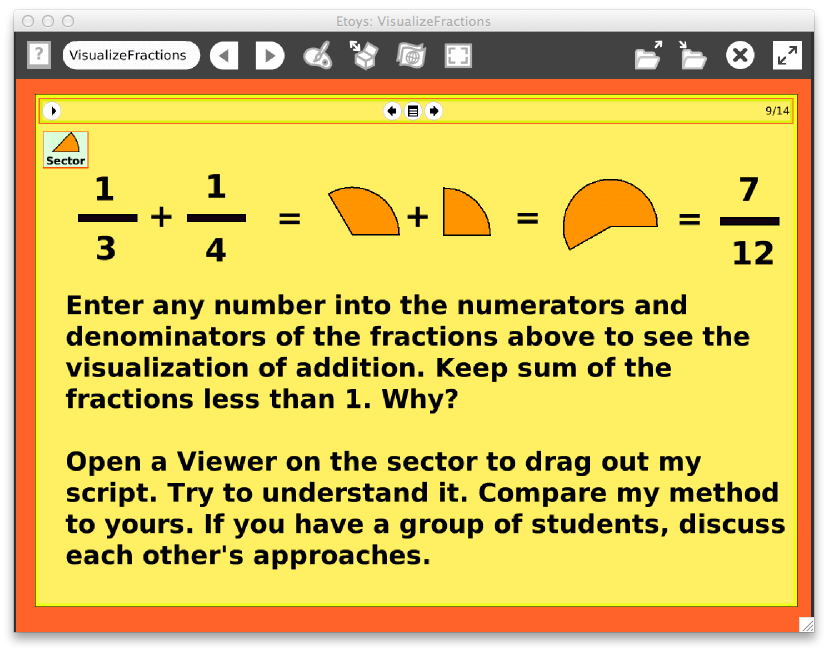
Now (pages 7 and 8) have your learners create a script to show a visualization of adding two fractions. Work in groups. Listening to and learning from each others' views is a valuable skill. They should be reminded of this as they work. After a fair attempt they can look at my solution on page 9.
On page 9 students should enter any number into the numerators and denominators of the fractions for a the visualization of addition. They should keep sum of the fractions less than 1. Why? Again discuss this point with your learners. Again, you should have your students open Viewers to analyze my scripts. Have your students group and try to understand my solution. Then they should compare their solutions with mine.
More Inspiration
Write scripts to visualize mixed fractions that are greater than 1. Write scripts to visualize subtraction, multiplication and division.