One of the most popular uses for OpenStreetMap data is to use it while traveling or away from your desktop computer. Since OpenStreetMap data is freely available, you can use existing tools to convert the data into formats that are compatible with many different devices and even to print it out in different formats and sizes. In this chapter we will explore some of the many ways you can use this great resource now that you know how to contribute to it.
Navigating with OpenStreetMap
You can use OpenStreetMap data to build files suitable for use in a Garmin GPS navigator like the eTrex or Nüvi. In this section, we will download a pre-converted piece of OpenStreetMap data and load it onto an SD card to be inserted into a Garmin device for use on the road. It is possible to convert OpenStreetMap data to Garmin formats yourself using free tools, but that information is beyond the scope of this book. To learn more about that process, visit the wiki page at http://wiki.osm.org/wiki/OSM_Map_On_Garmin.
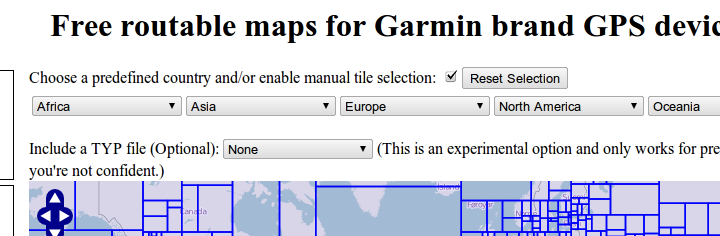
To begin, visit http://garmin.openstreetmap.nl/. You will be presented with a map of the world split into hundreds of rectangular areas and several drop downs listing the continents.
Using the drop down lists, find the geographic area you would like to upload to your Garmin unit. The corresponding rectangles in the map will highlight, giving you an idea of the area the downloaded data will cover. When you are satisfied with the selected area, find the "Email Address" field on the left-hand side of the page. Enter your e-mail address and click the "Build my map" button to request your data.
You will receive an e-mail from the system giving you a tracking number for the process and a rough estimate of your wait time. The system will notify you when it has completed processing your request with a separate e-mail that gives you a link and some instructions for use. Once you receive that e-mail, follow the link near the bottom of the e-mail and download the osm_routable_gmapsupp.zip file from the file listing.
Once you have that file downloaded, expand the .zip file so that a gmapsupp.img file is created. You need to copy this file to a specific directory on the SD card so that the Garmin unit will recognize it. Enable "Mass storage mode" in your Garmin unit's settings and connect it to your computer with a USB cable. The device should show up as a disk drive on your computer. Copy the gmapsupp.img file to the "Garmin" directory on your device.
When the file is done copying, safely disconnect the Garmin unit from your computer and unplug the USB cable. When you reboot your Garmin unit you will have new maps available using OpenStreetMap data. Congratulations!
Printing an OpenStreetMap atlas
Another common use for OpenStreetMap data is to print it and use it while away from the computer. You saw earlier that Walking Papers allows you to print out portions of OpenStreetMap to make it easier for editing, but we will discuss a different method of printing the map here that automatically creates an atlas with a text listing of the roads and a key to make it easier to use.
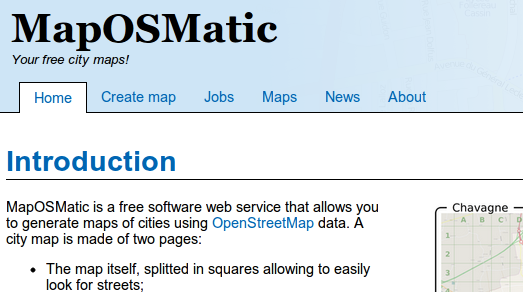
To start, visit http://maposmatic.org/. You will be presented with a webpage giving an overview of the MapOSMatic website and a link to "Create a Map".
Click the "Create a Map" button to start the process of creating the map. To begin, you need to specify a coverage area for your map. You can try to search for the area you're interested in with the "City name" text box, but if that doesn't work you can click the "Bounding box" button and hold down the control key while dragging to select the area of your map. Once you've selected the area of coverage, click the "Generate" button.
When you click Generate, a page showing the status of your requested map will appear and reload periodically, updating as your position in the queue changes. Eventually your map will render and a "Success" image will appear, indicating that your map is complete and ready for download. If your web browser stops reloading, or you close the page, you can go to http://maposmatic.org/jobs/ to see that status of existing maps, including yours. Once completed, your map will come in two pieces: a map page and an index page. Each of these can be downloaded in PNG, SVG, or PDF format to make it easier to print.
Congratulations! You have used OpenStreetMap data to quickly create a personalized atlas. If there's something missing from the map it is easy to add it yourself and re-create the map at a later time.
Offline maps on your smartphone
Mobile phones powerful enough to display OpenStreetMap data are very common and there are several freely-available apps for the various mobile platforms. You can use OpenStreetMap data on your phone to navigate unfamiliar territory and explore areas while away from the network connection usually required by other navigation tools. There are other apps across most of the different mobile phone platforms. For more information about mobile phone apps that use OpenStreetMap data, please visit http://wiki.openstreetmap.org/wiki/Software/Mobile.
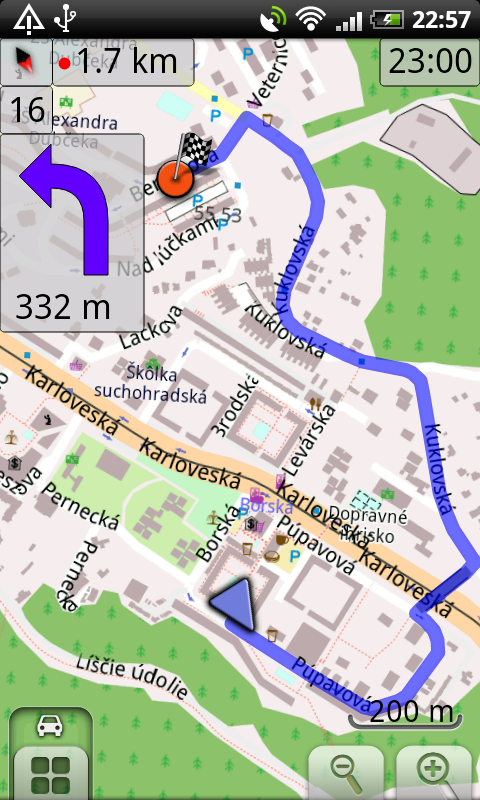
We will discuss one of many available Android applications: OsmAnd. OsmAnd is a turn by turn navigation application. It works both online and offline. The OsmAnd project has an aim to make navigation available for all and for free, which is why it is using Open Street Maps data.
OsmAnd running
Installing OsmAnd on Android
To begin, go to http://osmand.net/ in your phone's web browser and touch the "Installation" link on the left side of the page.
Tap the "OsmAnd latest" link to start downloading the latest version of the software.
Once the download is finished, go to your phone's Downloads app and tap the .apk file to begin installation. If you get an error during this process you might need to use your phone's settings to enable 3rd-party applications before trying again.
Once you have the app installed, run it and go to 'Menu'→'Data for Offline Usage'→'Download data for offline usage'.
When you download pieces of offline data from this area of the app, it will be installed onto your phone so it is visible while offline or away from a network connection.
Congratulations! You can now use OpenStreetMap on your mobile phone away from a network connection.
The OpenStreetMap is not just about the data, there is a vibrant community that meets both online and in person all over the world. People meet to do mapping, develop software and even to write this book!
Mapping parties and other social events
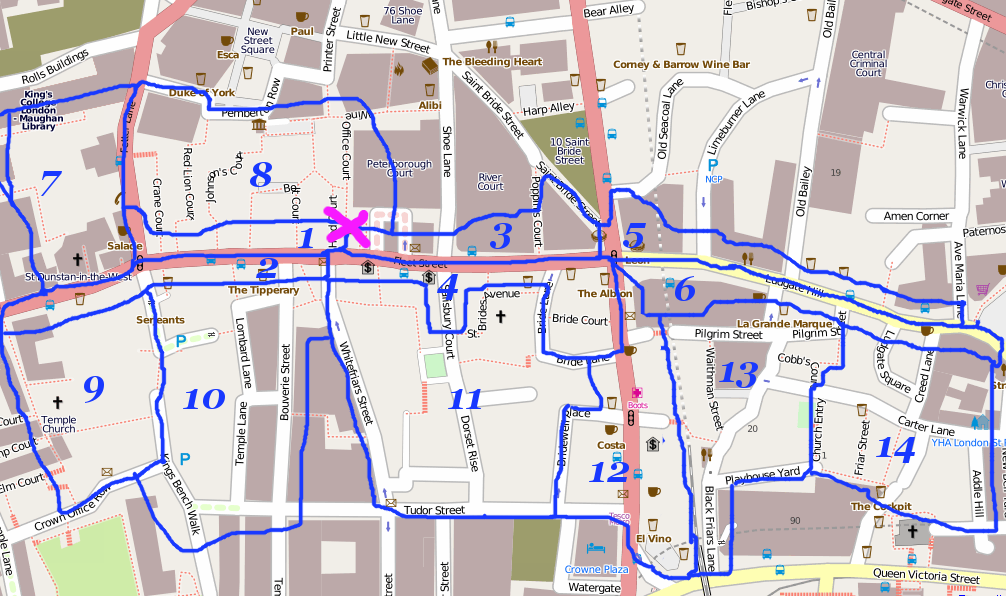
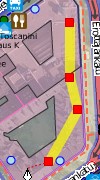
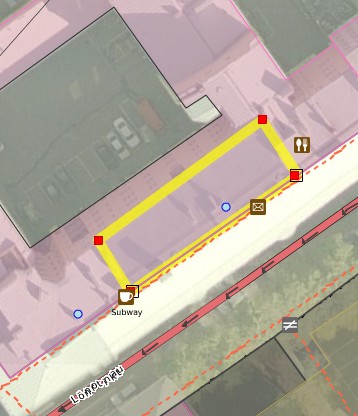
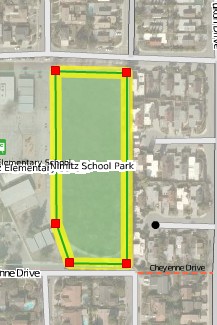
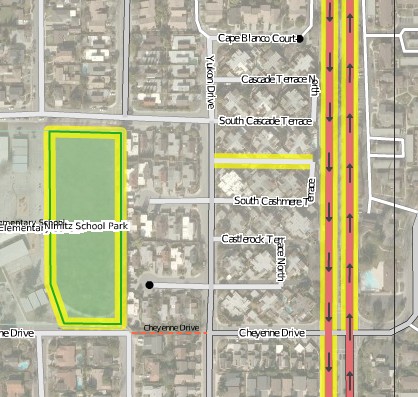
A mapping party is when members of the OpenStreetMap community get together to collect and add information to OpenStreetMap. One way of deciding who maps where is by creating a cake. Below is an example "cake" from a Fleet Street mapping party in London that took place in May 2010. As you can see, the area is divided up and numbered. Those who are attending pick a section they want to map and go collect data there. There is now a tool which makes this process easier called MapCraft (http://mapcraft.nanodesu.ru/). Some events bring people together to map on the way to a pub, where they gather socially afterwards. On other occasions, both the data collection and mapping occur, with a central meeting point such as a library, office or coffeeshop.
People come together in this way for a weekend or in the evenings, to map a specific area or simply catch up with other local contributors. There are also code sprints when OpenStreetMap contributors get together to improve OpenStreetMap software applications.
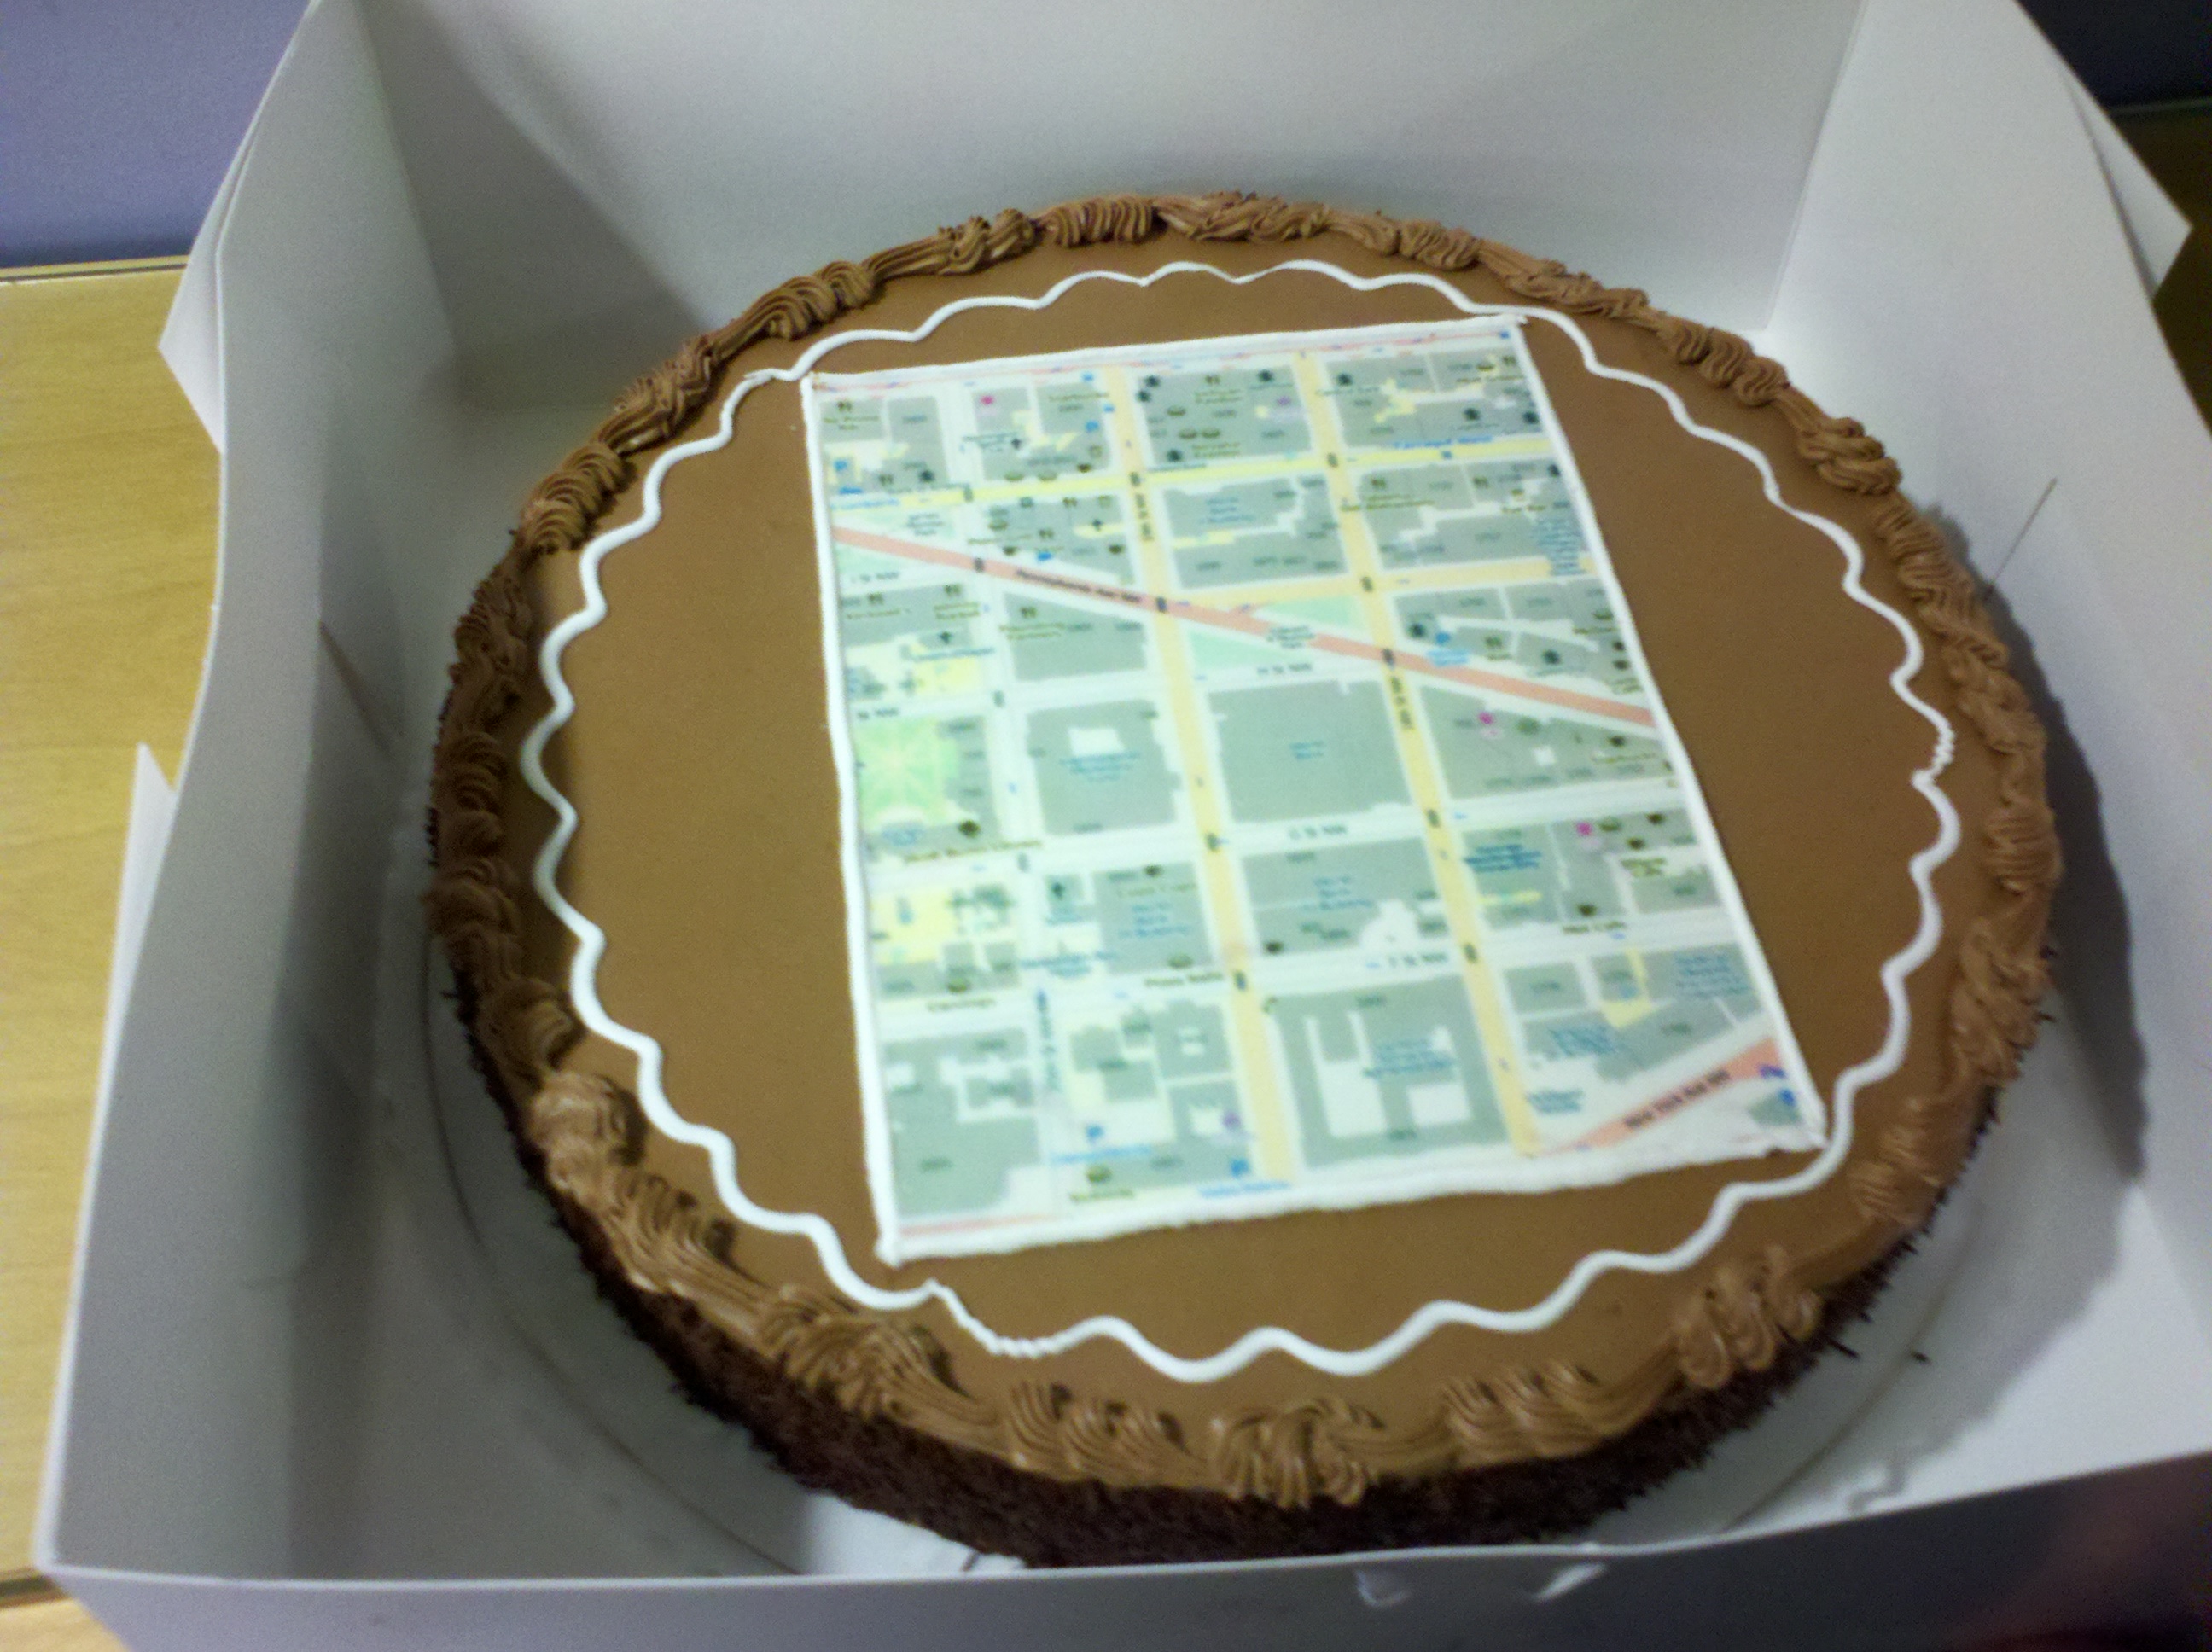
At many of these types of events it is common to create an actual map cake. The tradition of the map cake comes from an idea introduced by Iván Sánchez Ortega from the Spanish OpenStreetMap community. The idea is that if your data license is truly open, then it is perfectly reasonable to take the geographic data, print it on a cake and then consume that cake, without breaking any licensing rules. This has lead to many cakes being made for social events all over the world! Below is a map cake from a mapping party held at the World Bank in Washington D.C.
Mailing lists
The OpenStreetMap community has many mailing lists. There are lists for specific interests or topics, specific countries or regions, as well as general lists for discussion and for new people to ask questions. To find a current list of mailing lists, refer to https://wiki.osm.org/wiki/Mailing_lists.
IRC
Many people hang out on IRC, in an online chat room. This is used to collaborate and help each other in real time. This occurs on on the server irc.oftc.net. The most popular channel is #osm, but for more complex development questions, the #osm-dev channel is better. Often each language or region will often have their own channels. There is a full list of channels that people from the community use available on the wiki: http://wiki.openstreetmap.org/wiki/IRC.
You can use special software to access an IRC chatroom, but it is also possible to do it through your web browser. To access IRC through your web browser go to http://irc.openstreetmap.org/. Once you are there, choose a nickname and select the channel you would like to join.
Help
There is a question and answer site available in a similar style to StackOverflow. This is where people can ask and answer questions and vote on the usefulness of an answer. http://help.openstreetmap.org/
Forums
There are additionally web forums for discussing OpenStreetMap available at http://forum.openstreetmap.org/. These are less active than the mailing lists for many topics, but some communities prefer to use them for discussion instead of the mailing lists.
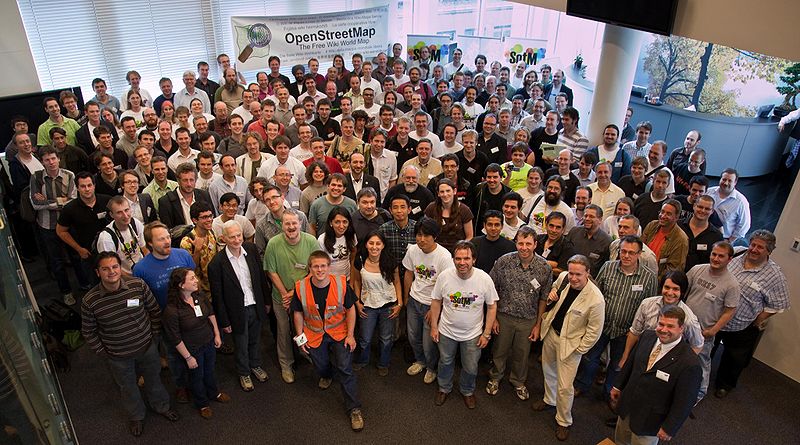
State of the Map conference
There is an annual conference called State of the Map or SotM, where people interested in OpenStreetMap from all over the world come together to discuss topics related to OpenStreetMap. The past few years have included one business day and two community days. The business day is for commercial interests surrounding OpenStreetMap and the community days are inclusive of any topics related to OpenStreetMap. State of the Map has its own website which includes general conference information (http://stateofthemap.org/).
Using your local knowledge of an area is the simplest and most effective way of collecting data for OpenStreetMap. For example, the knowledge you have of the area around your home and workplace is probably very up-to-date and accurate because you spend so much time there. Adding this data to OpenStreetMap using the provided aerial imagery as a guide is quite easy, and as you finish mapping more of your area you can work your way out into surrounding areas you might not know as well.
With this style of mapping, you can contribute some of the best, most up-to-date map data OpenStreetMap has to offer. More importantly, you will have a vested interest in the map of your area, making sure it stays up to date and error-free!
However, if you want to expand your work beyond maps from memory, there are two helpful tools for collecting data and bring them to OpenStreetMap. Lots of OpenStreetMap contributors use a Global Positioning System (GPS) device, or GPS. This chapter will explain what it does and how it works.
If you don't have a GPS or want to gather data without using it, it is also possible to collect data using Walking Papers. This chapter will also explain how to get started with these methods. Later, you'll learn how to use OpenStreetMap editors such as Potlatch 2 and JOSM to add the data you've collected to OpenStreetMap.
Collecting data with a GPS
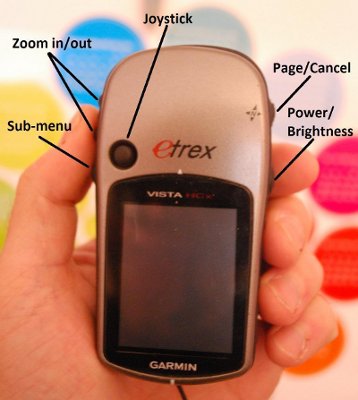
This chapter will teach you how to operate a GPS, and how to use it to create maps. More precisely, we will explain how to operate the Garmin eTrex Vista HCx, a common GPS used for mapping. There are many other models of GPS which do the same thing, so if you are working with a different one, don’t worry, the principles remain the same. If you don't have a GPS, that's okay too, just refer to Collecting Data with Walking Papers for another option.
What is GPS?
A GPS is like a mobile phone, except that instead of receiving radio signals from telephone companies, it receives signals from satellites that are orbiting the Earth.
A photo of a Garmin eTrex Vista HCx.
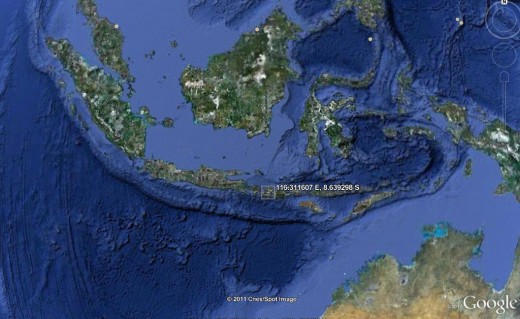
By receiving these signals from the satellites, a GPS is able to calculate your exact location on the planet. It records this location in coordinates, which are two long numbers. One number tells you how far East or West you are: this is called longitude. The second number tells you how far North or South you are: this is called latitude. Every place on Earth has unique geographic coordinates.
For example: -8.639298 Latitude, 116.311607 Longitude is a location in Lombok, Indonesia.
Google Earth software, showing coordinates of a place in Lombok, Indonesia
Turn on the GPS
Before you turn on your GPS, go outside where you have a clear view of the sky. Because the GPS determines your location by receiving signals from satellites, it won’t work indoors.
On the side of your GPS, press and hold the Power button. The GPS starts, and should show you the Satellites page. You might see something like the image below. Your GPS is looking for satellite signals. Once it has connected to three or more satellites, it can determine your location.
Acquiring Satellites
Once the device determines your location, the Satellite screen disappears and you see the main menu (like the picture presented in the next section).
Navigate the GPS menus
This GPS has different screens and menus that enable you to do different things. To switch between screens, press the button marked “X” (Page/Cancel in the photo of a Garmin eTrex Vista HCx), just above the power button on the right side of the device. This button also serves to go back. If you press something by mistake and would like to cancel or go back, press the “X” button.
There are many different screens for the Garmin eTrex Vista HCx below we are displaying the most important ones for gathering data for OpenStreetMap.
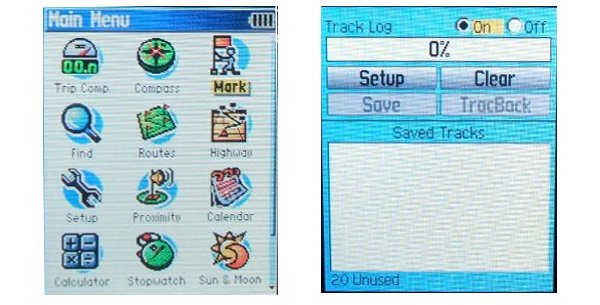
GPS Main Menuand GPS Tracks logs
By pressing the X button, you should be able to flip through different screens that will look something like this:
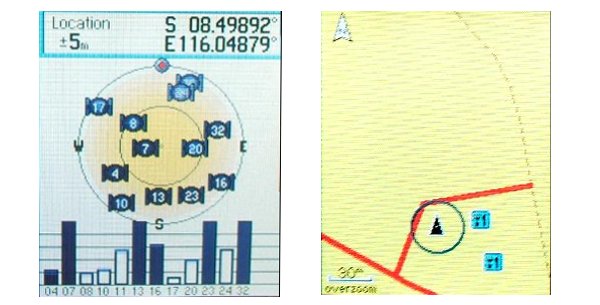
GPS Satellites and GPS Map
If you return to the Satellites page (left screen above), you can see that you are connected to three or more satellites. In the upper left corner are your coordinates, your latitude and longitude.
Flip to the Map page (right screen above), and you can see a map of where you are. If you have added OSM maps to your GPS, you may see roads and places. Otherwise, the map may look quite blank. Zoom in and out by pressing the up and down arrow buttons on the left side of the GPS.
Tracks and Waypoints
Your GPS records two kinds of information that are useful for creating maps or saving the coordinates of a place. First, it allows you to save your location in the memory of the GPS. When you save a location, the coordinates will be saved with a name. For example, your first saved point will be named 001, the second 002, and so on. When you save a point, you can write down the number on a piece of paper, along with a note about what it is, and any attributes or indicators you would like to know. Saved locations on your GPS are called waypoints.
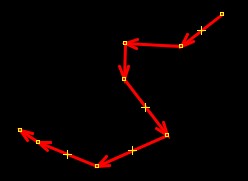
Second, your GPS can save what are called tracks. While a waypoint only saves a single location, a track saves a series of locations wherever you move. For example, the track records your location every one second, or every one meter, and the result will be a series of dots that show the path of where you have been. Tracks are useful for mapping objects that are represented by lines or shapes, such as the course of a road, or the shape of a field.
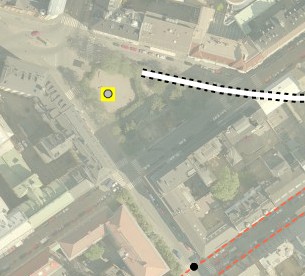
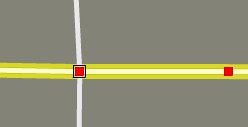
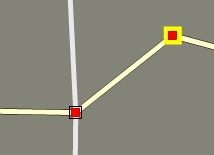
A GPS can record a single point as well as a path of where you travel. On some maps the points are numbered in the order they are recorded. The path, or “track”, is shown in green or teal color.
Path shown in the Potlatch 2 online editor
Save Your Location
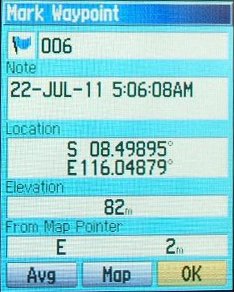
To save your current location as a waypoint, click the “X” button until your reach the Main Menu. Using the joystick, move it so that “Mark” is highlighted on the screen. Push the joystick button down to open the “Save Waypoint” page.
GPS saving waypoint
You can see on this page some information about the waypoint that you are saving. First is the number. If this is your first waypoint, it probably reads “001”. This is the number you should record on paper along with the information you want to collect with this object. Next, you will see the time and date when the point was recorded. Below that are the coordinates, followed by the altitude.
Use the joystick to move to the “OK” button at the bottom of the screen. Press the joystick button down to save this point. Be sure to write down the number of the point, along with what the place is and any other information you want to record about the place in your notebook.
Press the “X” button to go to the map page. You should now see your point on the map.
Turn on the Track Log
Now that we have learned how to save points, let’s learn how to turn the track log on and off. When the track log is turned on, it will automatically record your path. It’s good practice to turn on the log when you begin mapping, and turn it off when you are finished. You will then be able to look at the track on a computer and see the path that you mapped. If you would like to map the course of a road, it is a good idea to save a waypoint at the beginning and end of the road, writing in your notebook the name and type of the road, and any other important information about the road.
To turn on the track log, click the “X” button until your reach the page that says Track Log. (See Photo GPS Tracks logs )
If you would like to empty the track log to delete earlier recordings, use the joystick to select “Clear”, and press the joystick down. The bar at the top should read “0%”
To turn on the log, move the joystick to highlight “On”, and press the joystick down. The track log is now recording your path.
Press the “X” button to go to the map page. As you move you will see your track shown as a series of dots.
How to Copy Waypoints and Tracks to the Computer
When you are finished mapping with the GPS you will want to copy the points and tracks to your computer so that you can open them in the OSM editor.
Step 1: Attach GPS to the Computer
First, turn off the track log on your GPS, by going to the track page and selecting “Off”.
Attach the GPS to your computer with the cable. One end should plug into your computer’s USB port, and the other goes into the back of the GPS, beneath the rubber flap at the top. The GPS should be turned on to copy the points and tracks.
Step 2: Install GPS Drivers
You may need to install GPS drivers on your computer. If you have a copy of USBDrivers_23.exe on your Windows computer, double-click it and install.
Click “Download” to get the installation file. Locate it on your computer, and double-click to install.
Step 3: Get the GPSBabel Setup Program
GPSBabel is a program that allows us to copy data from the GPS. If you have a copy of GPSBabel on a CD or USB flash drive, you can skip to the next section.
If your computer runs on Windows, you want to download the installation file for Windows. Click “GPSBabel-1.4.2-Setup.exe” to download the file to your computer.
If your computer runs on Mac OS, click the .dmg file button.
If your computer runs on a Linux operating system, click the .tar.gz button.
Step 4: Install GPSBabel
Locate the GPSBabel setup file on your computer. Double-click it to start the installation.
On Windows, you click “Next” and accept all the defaults until the program installs. When the program has finished installing, click “Finish” to start GPSBabel.
On Mac and Linux, the program starts after opening and extracting the program.
GPSBabel Interface
Step 5:Copy Tracks and Waypoints
In the Input area, click in the circle next to the word “Device” at the top of the window.
In the drop-down menu labeled “Format”, select “Garmin serial/USB protocol”
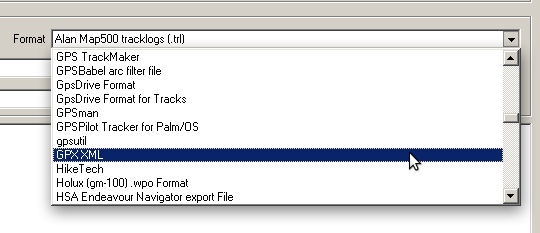
Go down to the middle of the window, under Output. In the drop-down menu labeled “Format”, select “GPX XML”:
Choose GPX XML
Click “File Name” and type a name for your saved file. It should be something that describes the data, such as the date and the location. For example, jakarta-07-07-2011.
Make sure your GPS is connected to the computer and turned on.
Click “Apply” in the bottom right corner of the window.
If all goes well you should see a bar move across the screen, indicating that the data is being retrieved from the GPS. When it is finished, your points and track are saved in the file that you selected.
If you see an error, you may need to upload your tracks and waypoints using a Garmin web interface, refer to connect.garmin.com for more information.
Summary
Congratulations! You should now have an understanding of how to use the GPS to collect data. If you haven’t already, practice saving points of some important locations.
In the next section, you can learn about Walking Papers, which is another way of collecting information for OpenStreetMap. With Walking Papers, all you need is paper and a pen, and you can collect the coordinates of places just like with a GPS.
Summary of collecting data with Walking Papers
In this section we will see how we can record the coordinates of places without a GPS. We can use a tool called Walking Papers, from http://walking-papers.org/, to print a map of an area, draw on it and add notes, and load the paper back into the OSM editor, where you can add your locations to OpenStreetMap.
Overview of Walking Papers
Before we go into detail about Walking Papers, let’s look at an overview of how the process works and what you need to begin. You need a computer with an Internet connection, a printer, and a scanner or a camera that can take high-resolution images. Here are the basic steps.
Step 1: Print a walking map of the area
Locate the area you want to print a map of on the Walking Papers website. Print out a map of this area. You can choose to print the current map of the area on OpenStreetMap, or you can choose to print aerial imagery, if it is available in your area.
Step 2: Add data to your printed map
Use your printed map to survey the area. Add more places by drawing them directly on the map. Draw lines for roads, shapes for buildings, and so forth. Write notes about each location directly on the map, or write numbers on the map that relate to numbers in your notebook, where you can write more detailed information about each object.
Step 3: Scan your paper into the computer
If you don’t have a scanner, you can take a photograph of the paper, if your camera or smart phone is able to take high quality pictures (1200x1600 will work, for example). Upload the image to the Walking Papers website. Make sure the Walking Papers Barcode is contained in your scan, it is needed by the Walking Papers website.
Walking Papers Barcode
Step 4: Load the Walking Paper in JOSM or Potlatch 2
Use the objects you drew as a reference to add them digitally into OpenStreetMap.
Detailed use of Walking Papers
We will now go into detail on how to use Walking Papers.
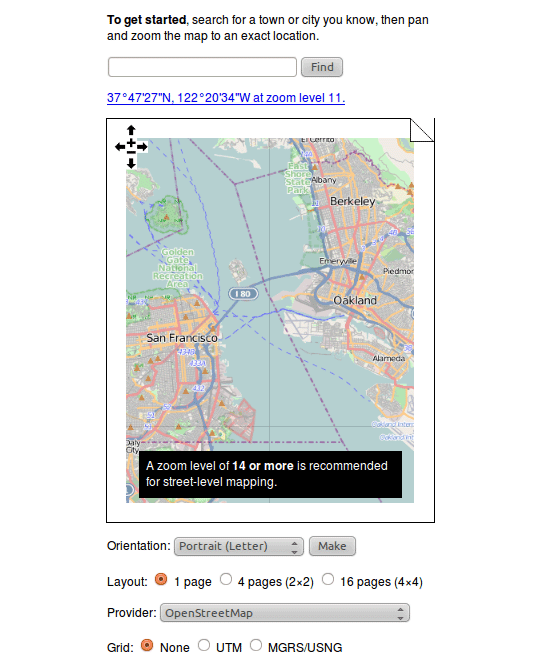
Scroll down the page until you see the map, as shown here:
Create a map print out using Walking Papers
The map that you see shows the area that you would like to print on paper. You can move the map the same way you move the map on the OpenStreetMap website, using your left mouse button to drag the map East or West, and your scroll wheel to zoom in and out of the map. Left-clicking on the + and – buttons in the upper left corner also zooms in and out.
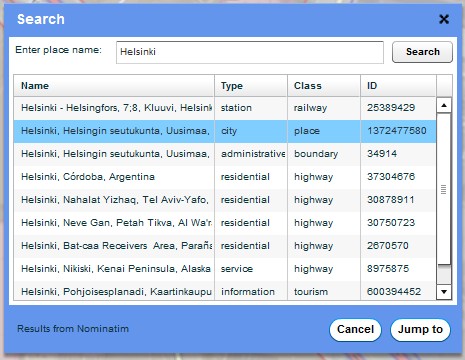
Just above the map is a search box with a “Find” button next to it. You can use this to search for a location and move the map there automatically. Try typing the name of your village or town inside the box, and click “Find”. If Walking Papers finds the location you typed, the map will automatically move there.
Just below the map are some additional options. The first option is labeled “Orientation.” This allows you to change the size and orientation of your printed map. Try changing this by clicking in the box next to “Orientation” and selecting “Landscape (A4)”. You should see the size and shape of the map change to be wide, and sized to be printed on A4 size paper.
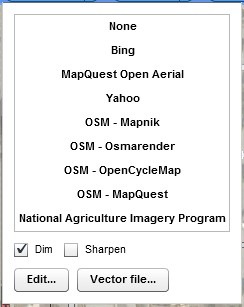
Click on the box next to the word “Provider:” Here you can select from different options that will change how the map looks. Most of the options show different styles of map, such as thinner lines, or different colors and text. Click on “Bing Aerial Imagery” and instead of a map you will see imagery provided by Microsoft of the location you are viewing. Note that not all locations are covered by high quality imagery, so what you see may be blurry, and not very useful for making maps!
Make sure that the map shows the area that you want to map. Even after you search for your location, you may want to move the map around to choose the right area. When you zoom in and out of the map, you are changing what are called “zoom levels”, which is simply a way of saying how close you are zoomed in. When you are zoomed as far away as possible and you can see the whole Earth, you are at zoom level 0. When you zoom in as far as you can go you are at zoom level 18. The current zoom level is shown just above the map. Usually zoom level 15, 16, or 17 is good for making Walking Papers.
Let’s make the print now! If you have found the area you are interested in mapping and have selected the options that make your paper look good, you are ready. Click the button labeled “Make”, just below the map.
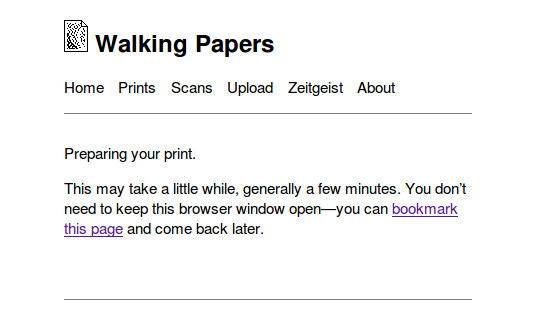
You will see a new page which says that your print is being processed. When it is finished, you will see your print on this page. It usually take anywhere from a few minutes up to twenty minutes for a print to be completed.
Walking Papers Processing
When your print is ready, click “Download map PDF for print”. The Walking Paper should begin downloading.
When the download is finish, open the PDF file. Connect your computer to a printer and print the page. If everything goes well, you should now have your map printed on paper.
A printed Walking Papers map ready to be scanned
Map with Walking Papers
Take your Walking Paper outside, and use it as a guide to walk and identify new places that are not on the map.
Draw lines for roads, shapes for buildings, and so forth. Write notes about each location directly on the map, or write numbers on the map that relate to numbers in your notebook, where you can write more detailed information about each object.
When you are satisfied with your additions on the paper map, then you can add them digitally into OpenStreetMap.
Scan and Upload
Walking Papers are very useful for mapping with nothing more than paper, but they are not 100% magic. We still need to add our paper into the OSM editor, add our information digitally, and save our changes on OpenStreetMap.
The first step is to scan your Walking Paper into your computer. You can do this by attaching a scanner to your computer, scanning the paper, and saving it as an image file. If you don’t have a scanner, you can take a photography of the paper, but you should be carefuly to take a very good photo. Make sure that the paper is flat and your camera is directly in front of it. Be sure to include the barcode in the image, as Walking Papers will not work without it. Here is an example of a scanned/photographed image:
Once you have your walking paper scanned and saved on the computer, open your web browser and return to walking-papers.org, just as before.
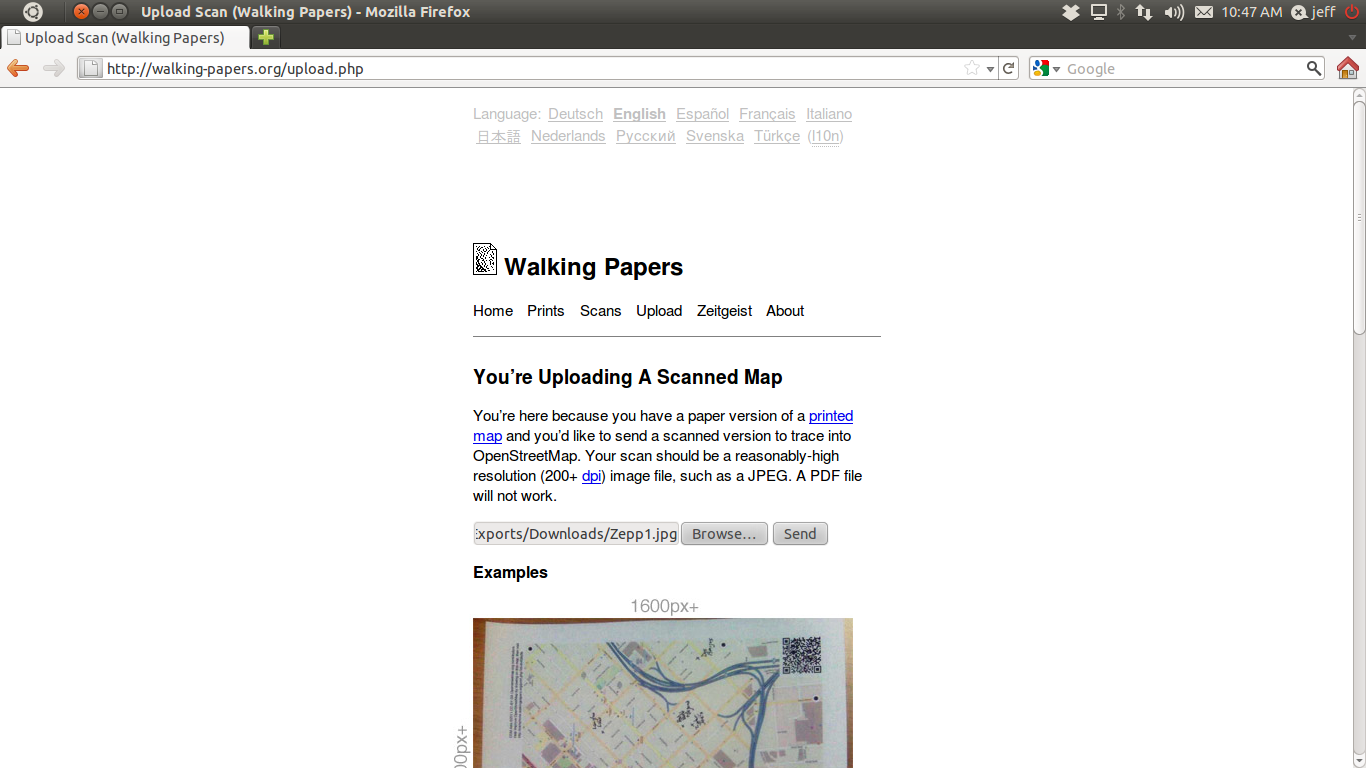
Click on the “Upload” tab.
Click “Browse…” and navigate to the file where you scanned/photographed your Walking Paper.
Click “Send.”
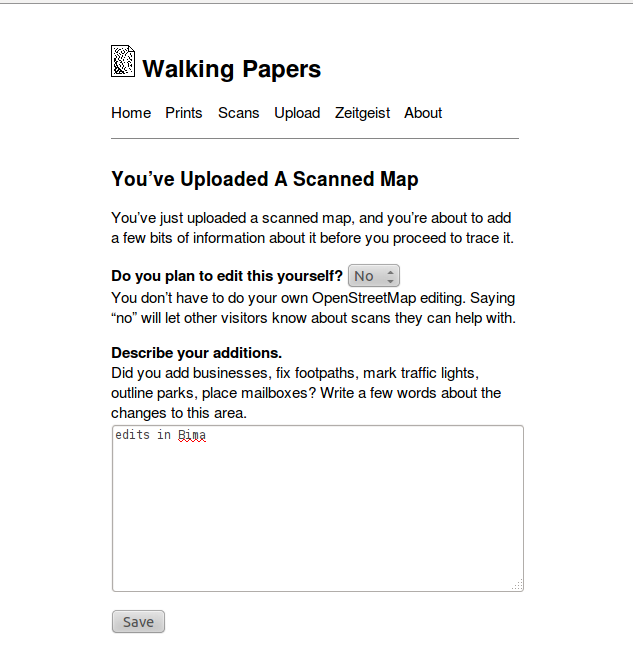
It may take a few minutes for your paper to upload, depending on the speed of your internet connection. When the upload finishes, you will see a new page with a couple questions about your scan.
Next to the question, “Do you plan to edit this yourself?” select “No”. This will make your paper public, so that other mappers can see it too.
In the empty box at the bottom, describe what you mapped. This might include the location and the types of objects that you added.
Click “Save.” Your Walking Paper will begin to process. This may take 20 minutes or more. If you made your paper public by selecting “No” on the previous page, you can close your internet browser and return to it later when it has finished processing.
Open in JOSM
When your scan has finished processing, you can load it into JOSM and use it to add your information to OpenStreetMap. Return to the Walking Papers website, by typing walking-papers.org in your web browser, just as before.
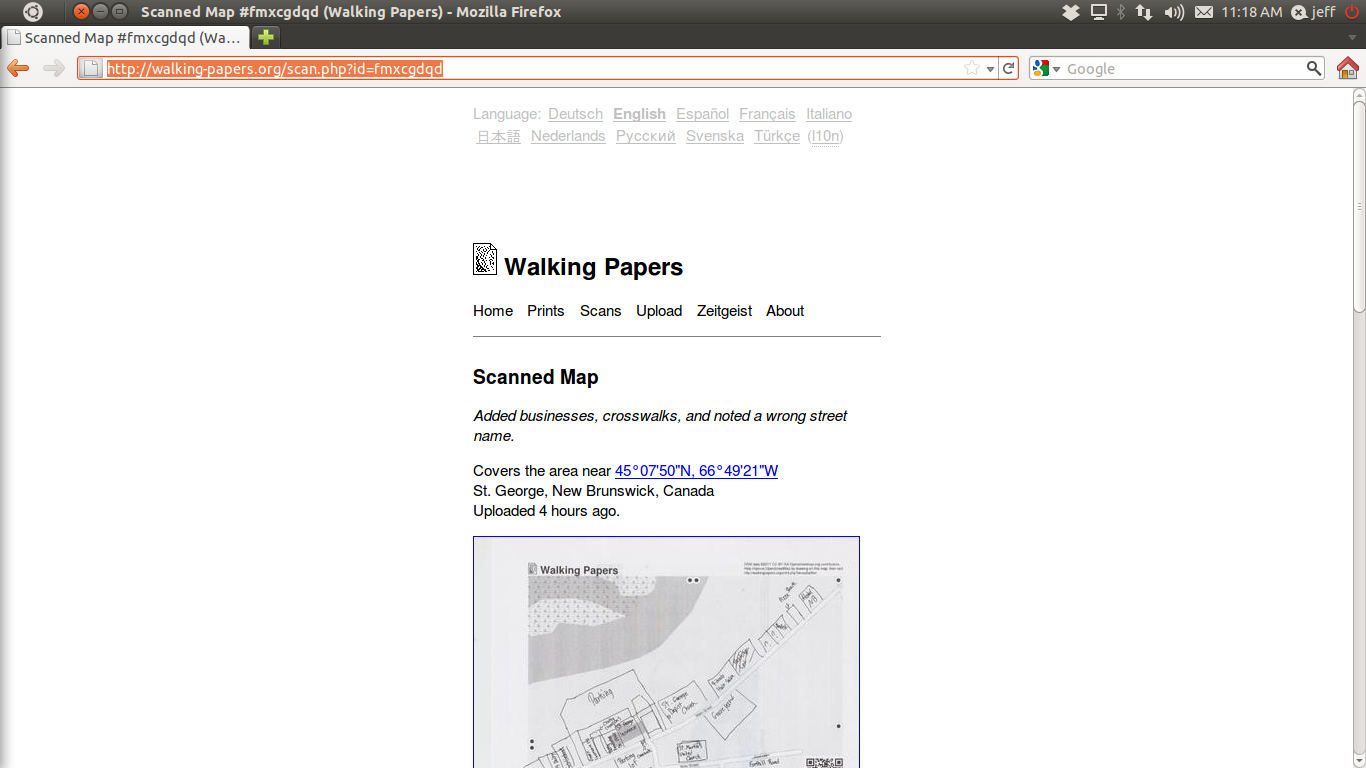
Click “Scans”.
Find your paper from the list, and click on it. You should see something like this:
To load the paper into JOSM, we need to copy the ID of the Walking Paper you have scanned. In the URL bar at the top of your internet browser, select the text and press CTRL+C on your keyboard to copy. The text should look similar to this: http://walking-papers.org/scan.php?id=fmxcgdqd
Open JOSM and on the top menu of JOSM, Click “Walking Papers”. Then click “Scanned Map…”
Press CTRL+V on your keyboard to paste the text that you copied from the Walking Papers website. Click OK.
If all went well, you should see your Walking Paper load into JOSM. In the next chapter, we will see how to add the places that you mapped into OpenStreetMap.
Repeat!
After you add your changes to OSM, they are saved on the map. Then the next time you want to improve the map, you can print out a new Walking Paper which includes the changes that you made. As this process is repeated, the map gets better and better, the more you map!
Summary
Congratulations! In this chapter you learned the process of using a GPS or Walking Papers and how they work. You learned how to print, map, and scan a Walking Paper. In the next chapter, we will learn how to add the places that we mapped into OpenStreetMap, and you will have learned the complete process of editing the map.
Summary: This book provides an introduction to collaboratively editing maps with OpenStreetMap and sharing the maps with others. It features stories about communities using the OpenStreetMap data and describes the tools used for map editing, including paper based data collection, mobile map applications, and serving map data using a web server.
Type of Document: collective handbook
License: cc-by-sa
Language: English
Other versions:
Authors:
Discovering collaborative mapping
Modifications:
annegentle - Anne Gentle 2011
booki - adam or aco 2011
iandees - Ian Dees 2011
tomh - Tom Hughes 2011
AnneGoldenberg - Anne Goldenberg 2011
Noirin - Nóirín Plunkett 2011
smsm1 - Shaun McDonald 2011
wonderchook - Kate Chapman 2011
TomiToivio - Tomi Toivio 2011
Welcome to OpenStreetMap
Modifications:
annegentle - Anne Gentle 2011
booki - adam or aco 2011
iandees - Ian Dees 2011
AnneGoldenberg - Anne Goldenberg 2011
Noirin - Nóirín Plunkett 2011
wonderchook - Kate Chapman 2011
TomiToivio - Tomi Toivio 2011
About this book
Modifications:
annegentle - Anne Gentle 2011
booki - adam or aco 2011
iandees - Ian Dees 2011
AnneGoldenberg - Anne Goldenberg 2011
Noirin - Nóirín Plunkett 2011
wonderchook - Kate Chapman 2011
TomiToivio - Tomi Toivio 2011
My first edit
Modifications:
booki - adam or aco 2011
iandees - Ian Dees 2011
AnneGoldenberg - Anne Goldenberg 2011
Noirin - Nóirín Plunkett 2011
wonderchook - Kate Chapman 2011
TomiToivio - Tomi Toivio 2011
Collecting data
Modifications:
annegentle - Anne Gentle 2011
booki - adam or aco 2011
iandees - Ian Dees 2011
AnneGoldenberg - Anne Goldenberg 2011
Noirin - Nóirín Plunkett 2011
smsm1 - Shaun McDonald 2011
wonderchook - Kate Chapman 2011
TomiToivio - Tomi Toivio 2011
Sharing your maps
Modifications:
annegentle - Anne Gentle 2011
booki - adam or aco 2011
AnneGoldenberg - Anne Goldenberg 2011
Noirin - Nóirín Plunkett 2011
smsm1 - Shaun McDonald 2011
wonderchook - Kate Chapman 2011
TomiToivio - Tomi Toivio 2011
Introduction to editing in OpenStreetMap
Modifications:
annegentle - Anne Gentle 2011
booki - adam or aco 2011
AnneGoldenberg - Anne Goldenberg 2011
Noirin - Nóirín Plunkett 2011
wonderchook - Kate Chapman 2011
TomiToivio - Tomi Toivio 2011
Editing with the online editor Potlatch 2
Modifications:
annegentle - Anne Gentle 2011
booki - adam or aco 2011
iandees - Ian Dees 2011
AnneGoldenberg - Anne Goldenberg 2011
Noirin - Nóirín Plunkett 2011
smsm1 - Shaun McDonald 2011
wonderchook - Kate Chapman 2011
TomiToivio - Tomi Toivio 2011
Editing with the offline editor JOSM
Modifications:
annegentle - Anne Gentle 2011
iandees - Ian Dees 2011
AnneGoldenberg - Anne Goldenberg 2011
Noirin - Nóirín Plunkett 2011
smsm1 - Shaun McDonald 2011
wonderchook - Kate Chapman 2011
TomiToivio - Tomi Toivio 2011
Editing with mobile editors
Modifications:
TomiToivio - Tomi Toivio 2011
Noirin - Nóirín Plunkett 2011
smsm1 - Shaun McDonald 2011
iandees - Ian Dees 2011
wonderchook - Kate Chapman 2011
Taking OpenStreetMap data with you
Modifications:
annegentle - Anne Gentle 2011
iandees - Ian Dees 2011
Noirin - Nóirín Plunkett 2011
smsm1 - Shaun McDonald 2011
wonderchook - Kate Chapman 2011
TomiToivio - Tomi Toivio 2011
Customising Potlatch 2
Modifications:
annegentle - Anne Gentle 2011
iandees - Ian Dees 2011
Noirin - Nóirín Plunkett 2011
smsm1 - Shaun McDonald 2011
wonderchook - Kate Chapman 2011
TomiToivio - Tomi Toivio 2011
eli4d - Eli Lev 2011
Understanding the OpenStreetMap data model
Modifications:
annegentle - Anne Gentle 2011
balrog - Andrew Zaborowski 2011
iandees - Ian Dees 2011
Noirin - Nóirín Plunkett 2011
smsm1 - Shaun McDonald 2011
wonderchook - Kate Chapman 2011
TomiToivio - Tomi Toivio 2011
eli4d - Eli Lev 2011
Providing maps for your web site
Modifications:
annegentle - Anne Gentle 2011
booki - adam or aco 2011
iandees - Ian Dees 2011
Noirin - Nóirín Plunkett 2011
smsm1 - Shaun McDonald 2011
wonderchook - Kate Chapman 2011
TomiToivio - Tomi Toivio 2011
Exploring the OpenStreetMap community
Modifications:
annegentle - Anne Gentle 2011
booki - adam or aco 2011
AnneGoldenberg - Anne Goldenberg 2011
Noirin - Nóirín Plunkett 2011
smsm1 - Shaun McDonald 2011
wonderchook - Kate Chapman 2011
TomiToivio - Tomi Toivio 2011
Useful websites and references
Modifications:
annegentle - Anne Gentle 2011
booki - adam or aco 2011
AnneGoldenberg - Anne Goldenberg 2011
Noirin - Nóirín Plunkett 2011
smsm1 - Shaun McDonald 2011
wonderchook - Kate Chapman 2011
TomiToivio - Tomi Toivio 2011
Credits
Modifications:
AnneGoldenberg - Anne Goldenberg 2011
annegentle - Anne Gentle 2011
Noirin - Nóirín Plunkett 2011
smsm1 - Shaun McDonald 2011
TomiToivio - Tomi Toivio 2011
All that you need to run Potlatch 2 is a Flash-compatible browser and an Internet connection. To customize Potlatch 2, you simply need a basic web server and permissions to upload files to it. You do not need to know Flash or Actionscript. You do not have to build Potlatch 2.
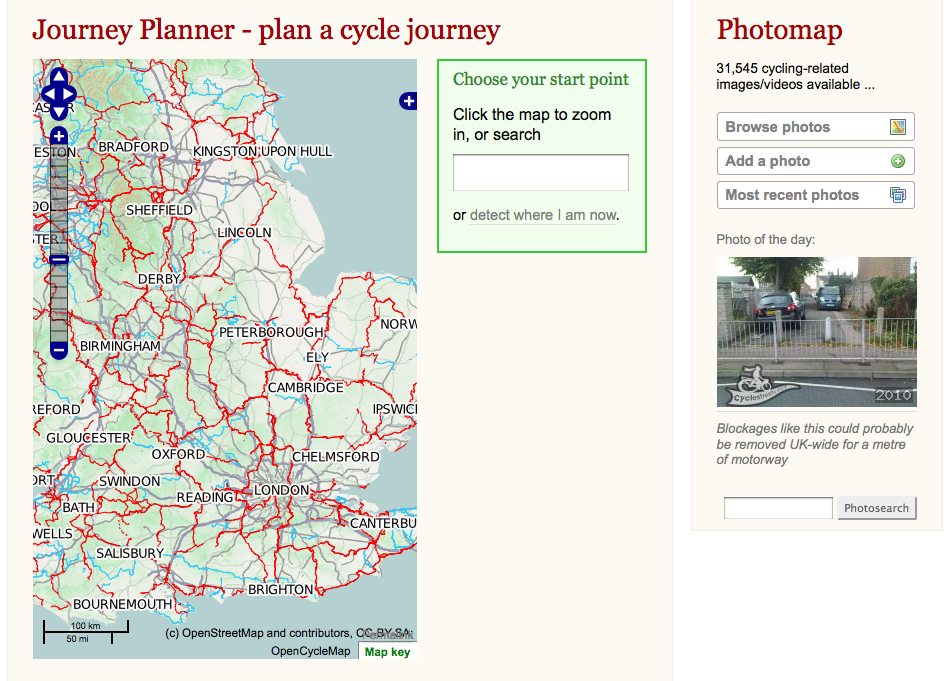
Potlatch 2 has a feature that allows you to style and customise the editor to specific needs. You can take the Potlatch 2 editor and put it on your own website, making it easy for a user to add or edit OpenStreetMap data relevant to the specific interests of your website. For example, the CycleStreets website (http://www.cyclestreets.net/) provides journey planning for cyclists using OpenStreetMap data. CycleStreet provides a customised online editor making it easier for people to add data that is relevant to cyclists and help with the improvement of the journey planner. Another example is OpenEcoMaps (http://www.openecomaps.co.uk) by Tom Chance, which is about green spaces.
You can change the style of the map and the controls on the left hand side of the map without writing any Flash/ActionScript code or compiling Potlatch 2. It does require you to know the basics of running a webserver, however, as well as HTML and JavaScript.
Deploying Potlatch 2 to your own site
You can add Potlatch 2 to your own site without making any customisations. This approach is a good way to get started.
Getting the files
Download all the files from http://random.dev.openstreetmap.org/potlatch2/, including the full contents of the features/, icons/ and fills/ directories. These are the resource files that are required by Potlatch 2.
The actual application itself is the potlatch2.swf file. The potlatch2.html file is an example file of a webpage your users could visit to use the customized additions. The Potlatch 2 swf and resources are updated often, so update your files regularly to ensure you get the latest improvements!
Upload all the files in the potlatch2 directory to a directory on your web server. The potlatch2.swf and potlatch2.html should be in the potlatch2 directory, but you should overwrite the example files in the potlatch2 directory using the following example.
Setting up Potlatch 2
There are some settings that need to be modified from the potlatch2.swf file to have the application working on your own website.
First you need to specify the starting location and zoom level of the map. In order to do this you pass in the query parameters lat, lon and zoom at the end of the url. Remember that zoom levels go from 1 until 18 and that 1 is a worldview and 18 is very close. For example if your URL is http://mycustompotlatch2.com/potlatch2.html you will want to add the following to the end "?lat=53.293456&lon=-6.20537&zoom=17". You also can specify the default location for when the query parameter has not been passed in within the html file with the lines:
lat=53.2934;
lon=-6.2053;
zoom=16;
The default configuration of the potlatch2.html configuration file points to an OpenStreetMap development server. You can use this server for testing with no consequences if you make a mistake. When you are done testing and wish to use the main OpenStreetMap server replace "api06.dev" with "www".
You can use Potlatch 2 immediately to view map information from your own website. This works both on the development server and the main OpenStreetMap server. However, in order to actually edit the data you must register your website as a new application in OpenStreetMap. To do this you need an OpenStreetMap account and to be logged into the OpenStreetMap website.
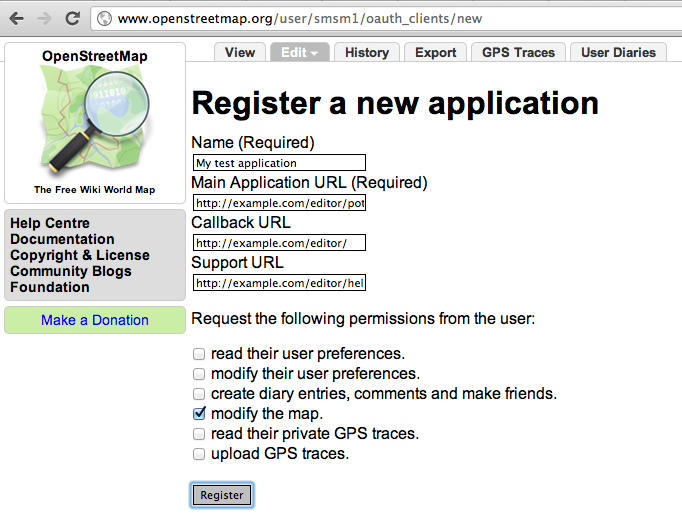
Click on your username in the right corner of the webpage to go to your OpenStreetMap user page. Then click oauth settings, and Register your application at the very bottom of the page. Note that you must register the application for every website where you customise Potlatch 2. To be able to test against the testing server (api06.dev.openstreetmap.org), you must also register on that server.
Note: You can not open the page via the file system locally on your computer and talk to the OSM server since Flash security does not allow this.
When prompted, enter the name of your instance (e.g. "My Custom Potlatch 2") and its URL (e.g. "http://mycustompotlatch2.com/").
Under 'Callback URL', you can optionally enter a intermediary page that lets your users know they are logged in and can begin editing on your website. Under 'Support URL', you can optionally enter a help URL if you have additional documentation for your instance of Potlatch 2.
For your instance of Potlatch 2 to work you check the modify the map checkbox and click Register. You will be given an OAuth 'consumer key' and 'consumer secret'. Copy and paste them into the relevant lines in your html file as is shown in the example below.
The icons on the left side of the Potlatch 2 editor are defined by the XML file resources/map_features.xml. This XML file is commonly called a presets file. There are links to other files within this file to group together some of the controls, rather than having a single very large file that is difficult to work with. To link an additional xml file to the map_features.xml file you use the "include" tag.
<include file="map_features/barriers.xml" />
Note: Nested files should also be valid XML, which means they should have a single root element - by convention, <featureGroup/>.
There are specific conventions for the types of XML tags you add to the presets files.
A feature is the distinct, recognizable type that will be presented to the user as "what this is". For example: trunk road, school, reservoir.
A feature category groups features together. For example: Roads, Paths, Accommodation, Sport and Leisure.
An input is a single editing control for a single tag. For example: a drop-down menu with yes/no options, or a free-text field for a name.
An input set is a group of inputs. It can be reused anywhere in the file, and nested in other input sets. For example: a bridge-type drop-down (bridge tag) and a layer slider (layer tag) could together form one input set.
To use these tags to create a simple tag editor, you should initially create the specific feature you are interested in, for example "school". Then define the category it belongs to, in this case "education". You then need to define what type of shape it applies to - for example can it be a point, a line or an area? In this case a school could either be a point or an area. Add the tags that define the feature and the inputs that the user can add or edit for this feature. An example snippet of XML for a school is below.
In this particular example there are a couple specifics that bear mentioning. Both the "<point/>" and "<area/>" show that schools can be drawn as a point or an area. Additionally the "${name}" is the actual name of the feature.
The line, area, point and relation elements define what entity type this feature can be. For example, a trunk road could be <line/> or <area/> (for roundabouts); a supermarket could be <area/> or <point/>; a football pitch or baseball field could only be <area/>.
The tag elements define all the tags that identify this feature.
The name attribute defines the name displayed in drop-down menus from which the user can choose.
The category element defines the feature category (see below) in which this feature is be grouped.
The help element defines a URL providing more information about this feature.
The input elements define editing controls available for this feature (see below).
The inputSet elements reference input sets (groups of editing controls) available for this feature. Their ref attribute relates to the id of an inputSet defined elsewhere in the file (see below).
The icon element defines a feature's graphical appearance within the tag panel.
Tag element syntax
The tag elements define all the tags that identify this feature. Often this will just be a single tag (for example, highway=trunk) but you may also specify more than one element (e.g. amenity=public_building; building=yes).
For each one, its k attribute defines the key to match, and its v attribute defines the value to match. These tags will be applied to the object when the user chooses this feature from the drop-down menu.
The optional vmatch attribute allows you to specify values which are matched, but not applied. This is useful for compatibility with legacy or minority tagging schemes. The attribute is parsed as a regular expression (the special value "*" means "any value"). For example:
<tag k="route" v="hiking" vmatch="hiking|foot"/>
Icon element syntax
The icon element defines a feature's graphical appearance within the tag panel. It is usually found within a <feature/>, but the same format is also used for route relation inputs (see below).
Its image attribute is the URL of an image to be shown when the feature is selected, and when the drop-down menu is open.
Its dnd attribute is the URL of an image to be shown in the drag-and-drop icon panel (default: same as image attribute).
Its background and foreground attributes are the colours in which the HTML fragment will be displayed.
Its content is an HTML fragment displayed next to the image when the feature is selected. Tag values (such as name and ref) may be embedded by using the ${key} syntax.
Feature categories
A feature category groups features together. Example categories include roads, paths, accommodations, sports, and leisure. Specifics in these categories appear in the main drop-down feature menu for example in the roads category specific types of roads would show such as residential, primary, and secondary.
You define a feature category like this:
<category name="Roads" id="roads"/>
To assign a feature to that category, use the <category> tag within the <feature> element. For example:
<category>roads</category>
Inputs
An input is a single editing control for a single tag. It is usually an element within a <feature/>. To allow inputs to be shared between features, it can also form part of an <inputSet/> (see below).
The simplest form of input is a freetext input:
<input type="freetext" presence="always" category="Naming" name="Ref" key="ref" description="Reference number of the road"/>
The key attribute defines which OSM key will be edited (for example, "highway").
The name attribute defines a label shown by the control.
The description attribute defines a tooltip shown on mouse-over.
The layout attribute defines whether the control's layout will be 'horizontal' or 'vertical' (default).
The category attribute in the input tag defines the name of the tab that the input will be shown under (not related to feature categories).
The subcategory attribute (optional) defines a subgroup under that tab (intended for lesser-used tags).
The presence attribute defines whether this input should be shown on the 'Basic' tab:
always - always show
onTagMatch - only show if the tag is set
withCategory - don't show on the Basic tab
The priority attribute controls ordering within the tab. The possible values going from the highest priority to the lowest are highest, high, normal, low and lowest.
The type attribute defines what control this is. The rest of this section defines these controls and their attributes.
type="choice"
A drop-down menu. <choice/> elements are used to define the options available (like <option/> in an HTML </select> element). For example:
A checkbox used to set the tag value to 'yes' or 'no'. (Values of "1", "0", "true" and "false" are recognised but not set.)
type="freetext"
A simple text editor. You can use the absenceText attribute to define the value when not set.
type="number"
A numeric entry textfield with additional "up" and "down" nudge buttons beside it. For example:
 <input type="number" minimum="0" maximum="99999" stepSize="1"
         presence="always" category="Parking" name="Capacity" key="capacity" description="The number of cars that can be parked in the car park"/>
The minimum and maximum attributes define the range of values allowed by the nudge buttons (default 0, 100).
The stepSize attribute defines the increment of clicking on an up/down nudge button (default 1).
The absenceText attribute defines text to be shown if the value is not set.
The notValidText attribute defines text to be shown if the value is not a number, or outside the minimum/maximum values.
type="slider"
A slider allowing any numeric value to be chosen between two extremes. For example:
The minimum and maximum attributes define the range of values allowed (default 0,100).
The snapInterval attribute defines the minimum increment between these values (default 1).
The default attribute defines the default numeric value if not set (default 0).
The labels attribute is a comma-separated list of labels to be laid out at equal intervals from minimum to maximum values.
A numeric entry textfield with additional "up" and "down" nudge buttons beside it. For example:
<input type="number" minimum="0" maximum="99999" stepSize="1"
       presence="always" category="Parking" name="Capacity" key="capacity" description="The number of cars that can be parked in the car park"/>
The minimum and maximum attributes define the range of values allowed by the nudge buttons (default 0, 100).
The stepSize attribute defines the increment of clicking on an up/down nudge button (default 1).
The absenceText attribute defines text to be shown if the value is not set.
The notValidText attribute defines text to be shown if the value is not a number, or outside the minimum/maximum values.
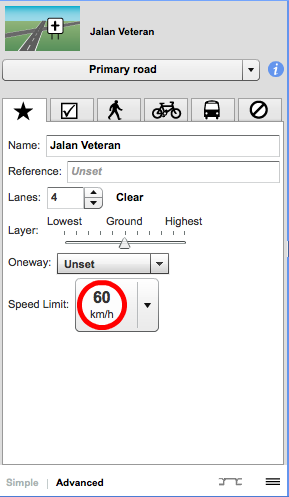
type="speed"
A dedicated speed-limit editor.
type="route"
A dedicated route relation editor, showing route relations of which this entity is a member, and allowing the user to add it to other route relations. For example:
<input type="route" name="National Cycle Routes" description="A signposted route in a National Cycle Network, or nearest equivalent." category="Cycle" priority="low">
  <match k="type" v="route"/>
  <match k="route" v="bicycle"/>
  <match k="network" v="ncn"/>
  <icon image="features/route__ncn.png" background="#ff6f7a" foreground="white">${ref} ${name}</icon>
</input>
The match elements define the tags required for a parent relation to match.
The icon element defines the appearance of the control shown for a matching relation (same syntax as an <icon/> within a <feature/>).
type="turn"
A dedicated turn restriction editor, showing turn restrictions of which this entity is a member, and allowing the user to add it to other turn restrictions. For example:
You can also customise the style of the map displayed by Potlatch 2. This is defined using the MapCSS form, which is very similar to cascading style-sheets. If you are familiar with the basics of making webpages this part should not be too difficult for you.
The style of the map is defined by MapCSS, which is similar to the CSS format. For more information about the MapCSS specification please take a look at: http://wiki.openstreetmap.org/wiki/MapCSS/0.2
JOSM is the Java OpenStreetMap editor. It is used for editing the OpenStreetMap data on a desktop computer. This means you don't have to be online to edit data. JOSM requires the Java Runtime Environment--if it is not yet installed on your computer, you can download it from http://www.java.com/en/download/ .
This chapter explains how to download and install JOSM, step by step. We will also cover changing some of the settings in JOSM to make it easier to use! Then we will open a sample map and learn about some of the basic operations of the software.
Downloading JOSM
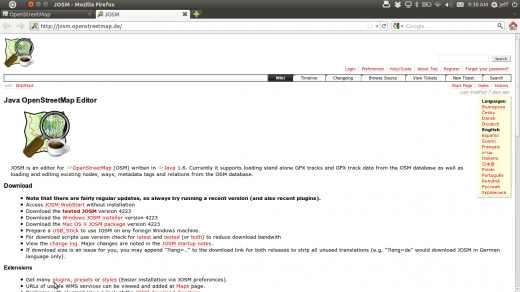
Go to the JOSM website at: josm.openstreetmap.de. You can also find this website by searching for “JOSM”.
The website looks something like this:
The JOSM Website
If you have Windows installed on your computer, click “Windows JOSM Installer” to download JOSM. If you have a different operating system, click on the link for your system. Your download should begin.
Note that in general, JOSM works the same on all operating systems, except for some installation steps. When required, we will specify the appropriate steps for your system.
Installing JOSM
Find the JOSM install file on your computer. Double-click it to begin setup.
Note: You must have at least version 1.6 of Java installed on your system for JOSM to work.
On Windows the installer first asks you to choose a language. Then you get a welcome screen click 'Next’. Click ‘I Agree’ to accept the license. Then you can choose the components you want (the defaults are usually fine). Finally choose the install location and click ‘Install’. When the installation is complete, click 'Next' and then ‘Finish’ to launch JOSM for the first time. Later, when you want to start JOSM, you can do so by clicking on the Start Menu in the lower left corner of your computer, and clicking the JOSM icon.
On Mac OS X, double-click the compressed file to open it and then double-click the Application file to launch JOSM.
You may see a window pop up that asks if you want to update the software. You don’t need to update it since it is new. Press the button that says “Cancel.” If you don’t ever want to see this message again, check the box at the bottom before pressing “Cancel.”
When JOSM starts, it looks like this:
The initial JOSM screen
Learning Basic Drawing with JOSM
Now let’s open up a sample OSM file to learn the basic ways to draw maps with JOSM. Note that this map is not real, in that it is not a real map of a real place, so we will not save it on OpenStreetMap.
Now open the sample map file in JOSM. Open JOSM. Click the “Open” button in the upper left.
Find the file sample.osm. Click on it, and then click “Open”.
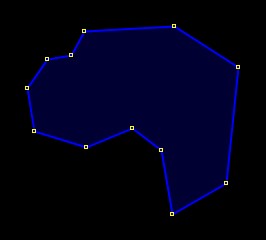
You should now see a sample map, similar to this:
Sample OpenStreetMap File
Basic Operations
To move the map left or right, up or down, hold your right mouse button down, and move your mouse.
There are several ways to zoom in and out of the map. If you have a mouse, you can use your scroll wheel to zoom in and out. If you are using a laptop and don’t have a mouse, you can zoom in and out using the scale bar in the upper left of the map window. Drag the bar left and right by holding your left mouse down and moving the bar left or right with your mouse.
Look at the sample map. There a few different types of objects here. There is a river, a forest, some buildings, several roads, and a couple of shops. To select an object, click on it with your left mouse button.
Points, Lines, and Shapes
As you click on different objects on the sample map, notice that there are three different types of object on the map. There are points, lines, and shapes.
Points are a single location, represented by symbols. On this sample map, there are two points, a clothing shop and a market. The clothing shop is represented by a shirt symbol, and the market is represented by a shopping cart.
There are several lines on the map as well, which represent roads. If you look closely you will see that within the lines, there are points as well. These points do not have any symbols or other information associated with them, but they help to define where the line is located.
Lastly, there are numerous shapes on the sample map, representing different places – a forest, a river, and buildings. A shape generally represents an area, like a field or a building. A shape is exactly like a line – the only difference is that the line begins at the same point where it ends.
You may notice that when you select an object, a list appears to the right of the map in a window called “Properties”. The items in this list are known as tags. Tags are information that is tied to a point, line or shape that describes what it is. For now all you need to know is that this information helps describe whether our object is a forest, a river, a building, or something else.
Think about drawing a map by hand, and how you are also drawing points, lines, and shapes. What other places are best represented by points? Lines? Shapes?
Changing Objects
Select the forest on the left side of the map. Be sure to click on the line around the forest, not one of the points on the line. Now hold your left mouse button down and drag your mouse. You should be able to move the forest to a new location on the map.
Click on on of the points on the line around the forest. Hold your left mouse button down and drag your mouse. You should be able to move the point. This is how you can change the shape of an object, or move a point.
Drawing
On the left side of a JOSM is a column of buttons. Many of these button open new windows on the right side that provide more information about the map. However, the most often used buttons are at the top of this column. These buttons change what you can do with your mouse.
The top four buttons in this column are the most important. They allow you to:
Select
Draw
Zoom in
Delete
Until now, you have been using the Select tool, which looks like this:
Before you draw, you need to make sure that nothing is selected. Click in the black space on the map, where it is empty, to make sure nothing is selected.
Click on the second button, the Draw tool.
Find an empty area on the map, and double-click with your mouse. This will draw a single point.
To draw a line, single-click with your mouse. Move your mouse and click again. Continue until you are happy with your line. To end the line, double-click your mouse.
Draw a shape the same way that you draw a line, but finish the shape by double-clicking on the point where you started the line.
Add Presets
Now we know how to draw points, lines and shapes, but we still haven’t defined what they represent. We want to be able to say that our points are shops, schools, or something else, and whether our shapes are fields, buildings, or something else.
Click on the Select tool, in the column of buttons on the left.
Select one of the objects that you drew with the Draw tool. On the top menu, click “Presets”. Move your mouse through the sub-menu to the type of location you would like to define.
When you click on a preset, a form will pop up asking you for more information. You do not have to fill in every field, but you may wish to add some of the important fields, such as the name of the object.
When you are finished entering the information, click “Apply Preset”. If everything went well, your point, line, or shape should change colors or show a symbol. This is because you have defined what it is.
Draw Your Own Map
Drag the map away from the sample map. Hold the right mouse button and drag your mouse, until you have a nice empty area to draw on.
Use the Draw tool to create points, lines, and shapes. Describe what your objects are by selecting from the Presets menu.
When you are finished, you should have your own map, similar to the sample map that we opened in sample.osm.
Editing OpenStreetMap
In this chapter we will learn how to edit the map on OpenStreetMap and add our improvements. We’ll learn the basic cycle of mapping on OSM.
Step 1: Download
Get the current map data from OSM.
Step 2: Edit
Modify the map using GPS, Walking Papers, and notes as a guide.
Step 3: Save
Save changes to OpenStreetMap.
Before you begin: prepare JOSM
To start JOSM on Windows, click on the Start Menu in the lower left corner of your computer, and find the program JOSM. On Mac, double-click the JOSM application to start it.
Next, load your gpx file and your Walking Paper. You don’t need to open both, but you can if you want.
Download OSM Data
Before we can edit the map, we must download the existing OSM data in our area. To download the data, we need to be connected to the internet, because we are in fact downloading the data from OpenStreetMap.
When you open your gpx track or Walking Paper, the map window will show what you have opened, and will automatically move to the correct coordinates. After you open your files, look in the bottom left corner of JOSM. You can see the latitude and longitude (coordinates) of your mouse cursor.
Because our map window is already showing the area that we want to edit, it is easy to download the OpenStreetMap data for this area. Click on “File” in the top left corner of JOSM and click “Download from OSM”. This will open up the download window. You can access this window more simply by clicking on the download button, shown here:
When the download window opens, you should see a map with a pink box drawn on it. If you don’t see the map, click on the tab marked “Slippy map”.
The pink box represents the area of the map that we would like to download for editing. Unless you have moved the map window since you opened your GPS file or Walking Papers, the box should be drawn around the correct area. However if you would like to download a larger area, you can draw a new box. To draw a new box, click on the map, hold your left mouse button down, and drag your mouse to create a box. Release the mouse button to finish drawing the box.
When you are satisfied with the size and location of the box, click “Download” at the bottom of the window. JOSM will get the data for this area from OpenStreetMap and open it in your map window for editing.
Edit
The next step is to edit the map and add new items. This is not always easy at first, but with practice you will get better and better.
If you want to move a point, line, or shape, use the select tool. Click on an object and drag it where it should be. This can be used to correct the location of items that have been put in the wrong place.
Use the draw tool to draw new points, lines, and shapes. Describe these objects by selecting from the Presets menu.
Remember that your GPS points and your Walking Papers don’t automatically go into OpenStreetMap. You need to add them to the OSM map digitally, using the draw tool. But your points, tracks, and Walking Papers can be seen in the background as a guide.
Let’s assume that you saved a waypoint on your GPS named 030, and you wrote in your notebook that 030 is a school. To add this point into OpenStreetMap, you should select the draw tool, and double-click on top of point 030 in your map window. This will create a point. Then go to the Presets menu, and find the preset for school. Enter the name of the school and click “Apply Preset”. Do the same to add lines and shapes.
Upload Changes
After you have made a couple of changes to improve the map, let’s save those changes to OpenStreetMap.
Click “File” on the top menu, and then click “Upload Data”. This will open up the upload window. You can access this window more simply by clicking on the upload button, shown here:
The window that appears shows a list of the objects that you are adding and the objects you are modifying or deleting. In the box at the bottom you are asked to provide a comment about the changes that you are making. Type in here a description of your edits.
Click “Upload Changes”.
If this is your first time saving changes to OpenStreetMap, you will be asked for the username and password that you created in Chapter 2. Enter them in the window that appears. If you check the box in this window, your username and password will be saved and you won’t need to enter them again in the future. Click “Authenticate”.
You will need to wait a few seconds for your changes to be uploaded, and then you are done! You have made your first edits to OpenStreetMap. You may continue editing to add all your points if you wish. Always be sure to upload your changes before you close JOSM.
See Your Changes on the Map
Open your internet browser and go to openstreetmap.org. Move the map to the area that you edited.
You should see your changes now appearing on the map! If you don’t, try pressing CTRL+R to refresh the web page. Sometimes the map doesn’t update properly and needs to be reloaded.
What if you don’t see your changes? Don’t worry – it may take a few minutes for the changes to be shown on the map. Also, check your additions in JOSM to make sure that you added them correctly. A good general rule is, if your point has an icon in JOSM, then it should be seen on the main map at the OpenStreetMap website.
More JOSM
Now you have learned how to draw points, lines, and shapes in JOSM, how to open your GPS waypoints and tracks in JOSM, and how to download, edit, and upload your changes on OpenStreetMap. Now we will describe in more detail some of the features of JOSM, so that you can beyond the simple editing tools and have a better understanding of the software.
Useful Features of JOSM
JOSM has many different features. The main window in JOSM you are already familiar with – this is the map window, and it is where most of the action takes place. Here you view, edit, and add to the OpenStreetMap data.
To the right of the map window are a series of panels, which each do something different. Typically when you first install JOSM several panels are shown by default, such as Layers, Properties, and Selection. When you select a point, line, or shape in the map window, it will be shown in the Selection panel. Information about the object will be shown in the Properties panel, and the username of the author of that object will be shown in the Authors panel.
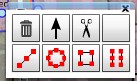
On the left side of JOSM, there are several toolbars, which consist of many buttons. At the top of this bar are different buttons which change what you can do with your mouse. You are already familiar with the first two, the Select tool and the Draw tool. The other tools make it easier to zoom in, delete an object, draw a shape, or create a line that is parallel to another line.
Below these tools are many more buttons. These buttons control what you see on the right side of JOSM. Using these buttons you can open and close the boxes on the right, such as properties, selection, and author.
JOSM Layers
Open your GPS file and download data from OpenStreetMap, if you haven’t already. You may notice that when you open a file, or add Walking Papers, or download from OpenStreetMap, another item is added to the Layers panel on the right side of JOSM. Your Layers panel may look something like this:
Each item in this list represents a different source of data that I have open in my map window. In the example above, “Data Layer 2” is the OpenStreetMap data that I want to edit. “Markers” are the waypoints from the GPS, and “30 Juni 2011.gpx” is the track from the GPS. Finally, “Walking Papers” is the layer created when I added my Walking Paper into JOSM. I can add the Bing imagery layer, which shows satellite imagery, by clicking “Imagery” on the top menu of JOSM and selecting “Bing Sat.”
To hide one of these layers you have displayed, select one of them with your mouse and click the Show/Hide button that looks like this:
You should see the layer that you selected disappear in the map window. Click Show/Hide again, and it will reappear.
You can close a layer by selecting it and using the delete button:
Lastly, it’s important to know that you can only edit the layer that is considered active by JOSM. If you are unable to edit the map in your map window, it’s probably because you don’t have the correct layer set as active. Most layers, such as GPS points, Walking Papers, and satellite imagery, can’t be edited. The only layers that can be edited are data layers from OpenStreetMap, which are usually called “Data Layer 1”.
To make a layer active, select it in the Layers panel, and click on the Activate button:
Saving OSM files
Sometimes after you download some OSM data, you may wish to save it so that you can edit it offline, and then upload it later when you have internet access again.
To save an OSM file, make sure that it is the active layer in the the Layers panel. Click “File” on the top menu, and click “Save”. Choose a location for the file and give it a name. You can also save by clicking this button:
You can now close JOSM and your data will be saved. When you want to open the file again, simply open JOSM, go to the “File” menu, and click “Open…”
Additional Drawing Tools
JOSM has some additional tools to make it easier to draw lines and shapes. These tools are found in the “Tools” menu at the top of JOSM.
In order to apply the functions in this menu, you must first select a point, line or shape in the map window. Some of the most useful functions are described here:
Split Way – This allows you to divide a line into two separate lines. This is useful if you want to add different attributes to different parts of a road. To use this function, select a point in the middle of the line that you want to split, Select Split Way from the Tools menu, and your line should be split in two.
Combine Way – This does the opposite of Split Way. To combine two lines into a single line, they must share a single point. To use this function, select both lines that you want to combine. You can select more than one object by holding the SHIFT key on your keyboard and clicking on each line. When you have selected both lines, select Combine Way from the Tools menu.
Reverse Way – This will change the direction of the line. If your line represents a road that is one way, you may want to change its direction. In other cases, direction doesn’t matter.
Simplify Way – If your line has too many points in it and you’d like to make it simpler, this will remove some of the points from a line.
Align Nodes in Circle – If you are trying to make a circular shape, draw the circle as best you can and then select this function. It will help arrange your points in a circle.
Align Nodes in Line – This function will align a series of points into a straight line.
Orthogonalize Shape – This function is very useful for drawing buildings. After you draw a building, this function will reshape it to have square corners.
Tags
When you draw a point, line, or shape, it is create with a location, but no information about what it is. In other words, we know where it is, but not what it is. Before now, we have been using items from the Presets menu to define what it is.
The way OpenStreetMap knows what an object is is by using tags. A tag is like a label that you can put on something. For example, if I draw a square, it’s only a square. But then I add multiple tags to it that describe what it is:
this square is a building
the name of the building is “Menara Thamrin”
the building is 16 levels high
You can add as many tags as you want to an object. Tags are saved as pairs of text, called keys and values. In OpenStreetMap, the information written above would be tagged as:
building = yes
name = Menara Thamrin
building:levels = 16
If you select an object in JOSM, you can see all the tags that are attached to it in the Properties panel on the right.
You can add, edit, and delete these tags from this panel. The tags are traditionally in English however, so it is often better to use the Presets menu.
Keyboard Shortcuts
Sometimes it can be annoying to click over and over to select different options and menus in JOSM. Luckily there are shortcut keys on the keyboard that allow you to do many common tasks. Here is a list of some of the most commonly used shortcut keys, along with what they do:
There are several editors available for mobile phones. Mapzen POI Collector is an application available for both Android and iPhones. Mapzen is aimed to be easy to use and make it easy for ordinary people to start mapping easily.
Vespucci is an application for Android phones that can be used for GPS point gathering and basic OpenStreetMap editing. It is aimed at more advanced users, as you need to know the tagging scheme used.
Editing with Mapzen POI Collector
Mapzen is available from both the Android Marketplace (https://market.android.com/details?id=com.mapzen) and the iTunes Store (http://itunes.apple.com/gb/app/mapzen-poi-collector/id338079717?mt=8). When you enter an area that you want to you open the app and the map will open in the location that the map was last shown. To get to your current location you select the android menu, and choose My location. The screenshots here are taken from the Android version of the App. The iPhone version is similar.
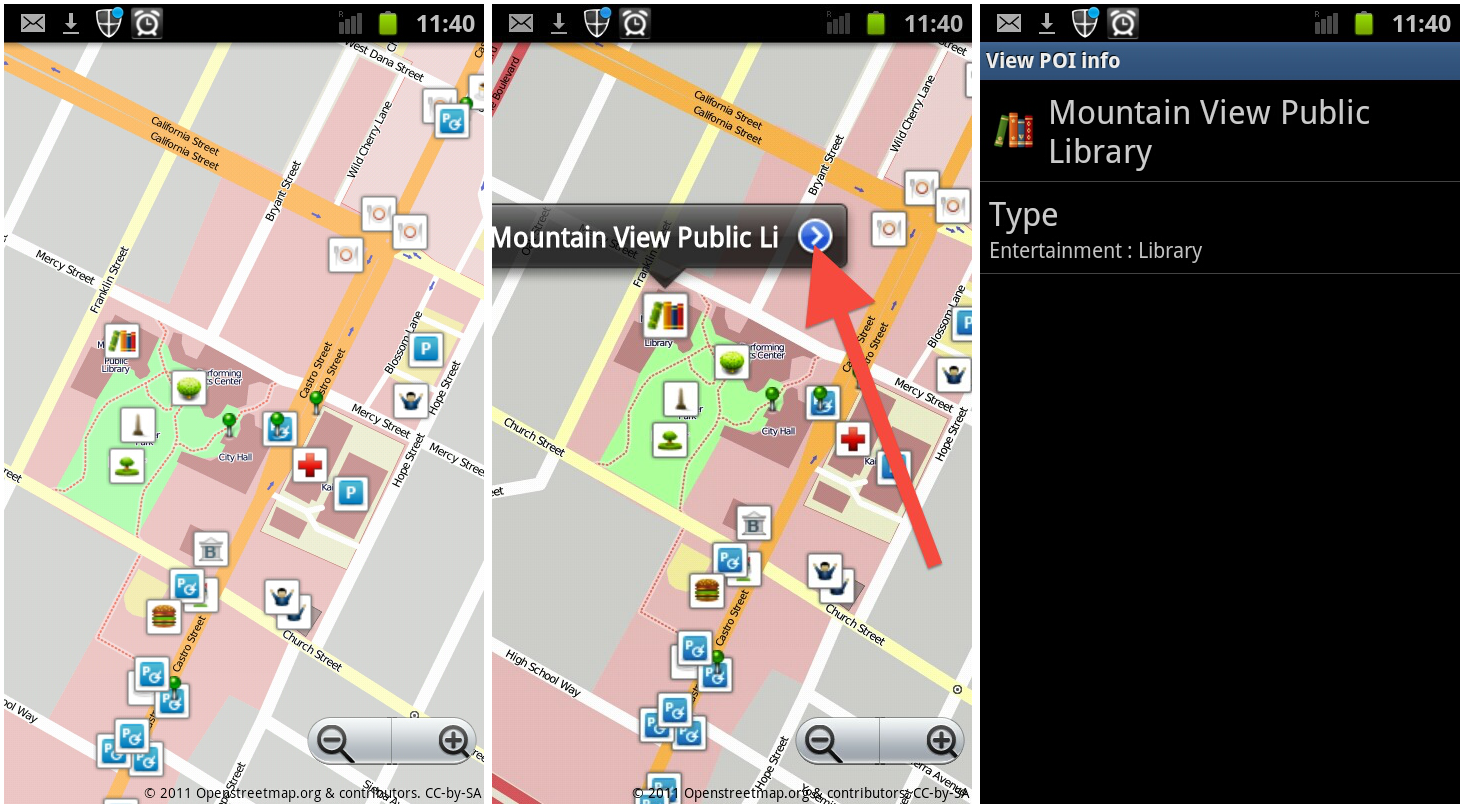
Mapzen is focused on simple editing of points of interest (POIs). The current set of POIs will automatically load. You can select a POI to get more info about it by tapping the little blue arrow.
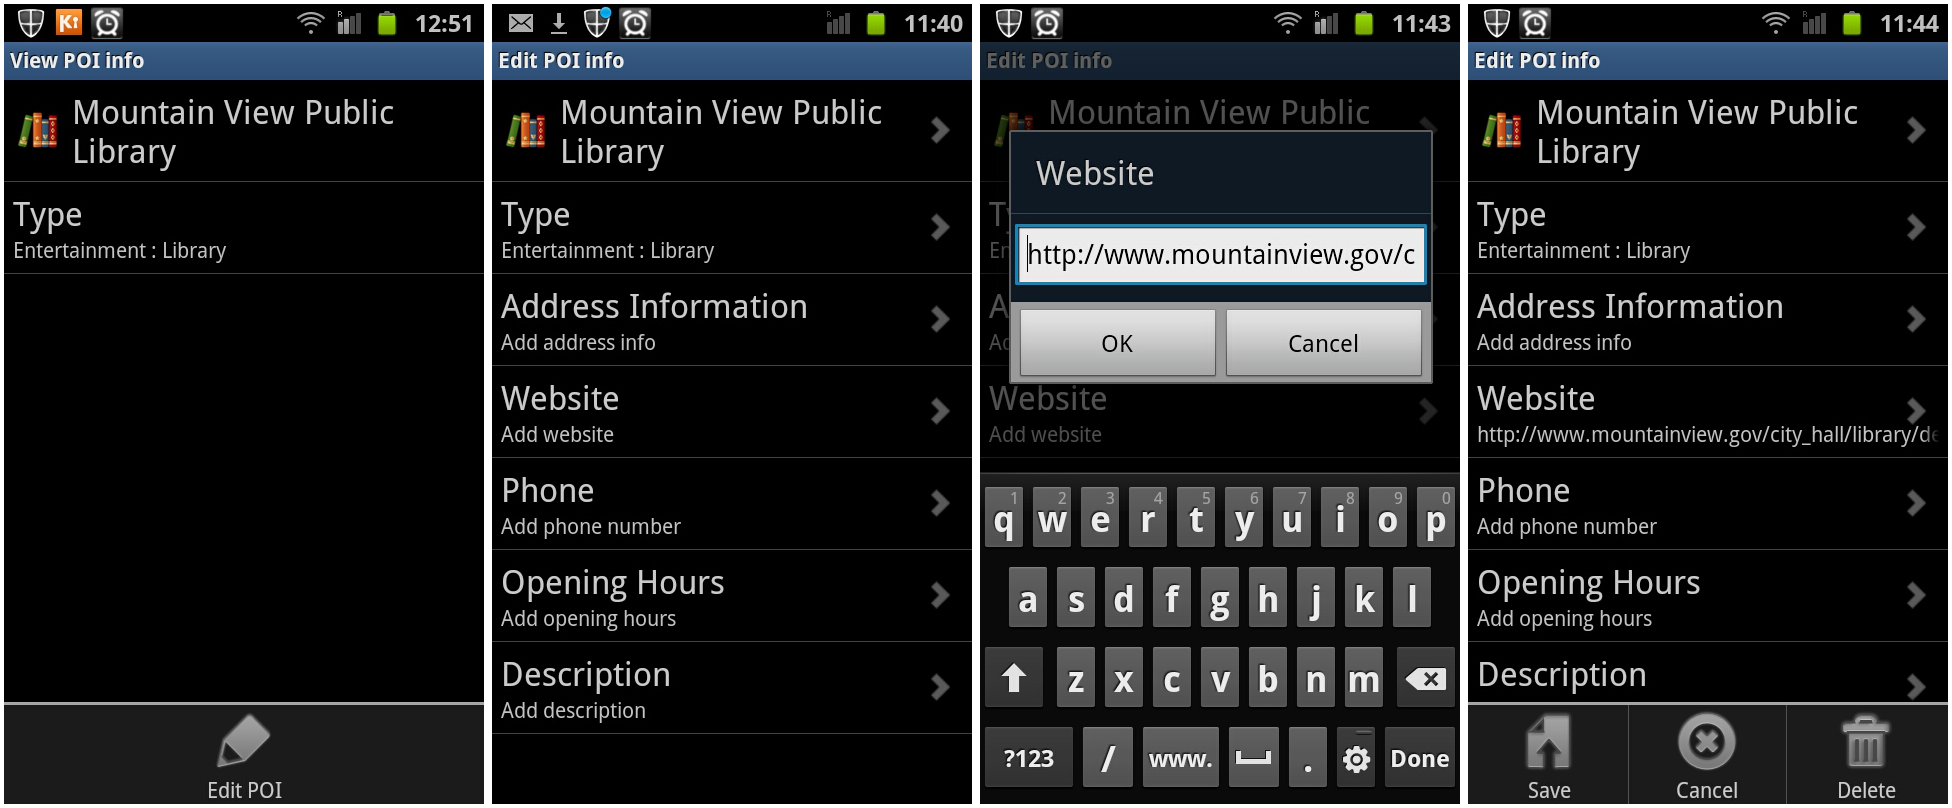
Editing a current point involves selecting a point and going through the menu system to change the properties of it, and then finally saving it.
We did not go very in depth into Mapzen POI Collector, because the application is intended to be intuitive.
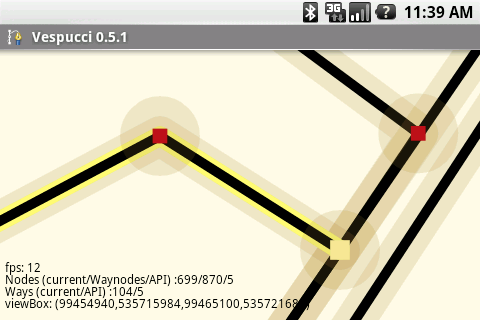
Editing with mobile editor Vespucci
Vespucci is an advanced editor that allows you to update the OSM data in the field. Refer back to the JOSM section to understand tags. You also need to know about the OSM data model (a chapter in this book) and the tagging scheme which is described on the OSM wiki on the Map Features page: http://wiki.osm.org/wiki/Map_Features. You currently can't edit relations with Vespucci.
Installing Vespucci on Android
You can download Vespucci from the Android Market by searching for "Vespucci" or going to the following page (https://market.android.com/details?id=de.blau.android), and following the usual installation procedure for your phone.
Setting up Vespucci
To be able to edit OSM data you need to enter your OSM username and password into the settings.
Start Vespucci application on your Android.
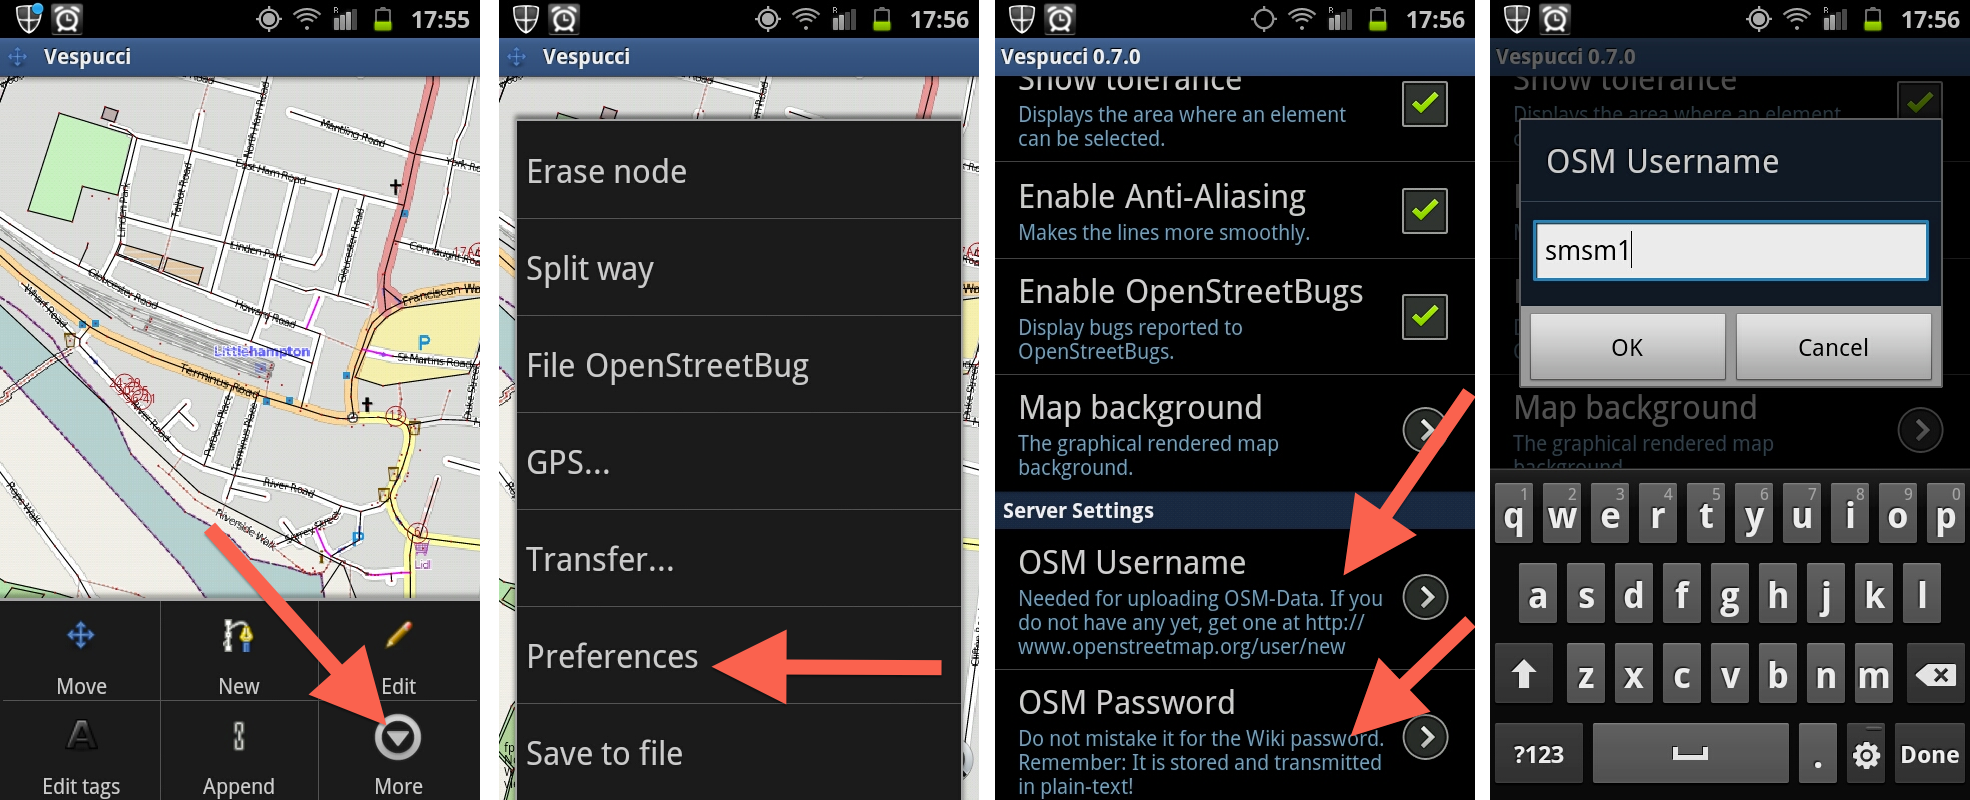
Press the Menu button on your Android phone.
Select More and Preferences.
Enter your OSM Username and OSM Password.
Downloading OSM Data
Once you are in an area you need to start the app, get your current location and download the current OSM data for the area.
To get your current location to show press the phone's menu button, More, GPS... and Follow GPS position or Start/pause GPS track.
Vespucci should center the map on your current location.
To download the current data press the phone's menu button, and select More and then Transfer... and Download current view.
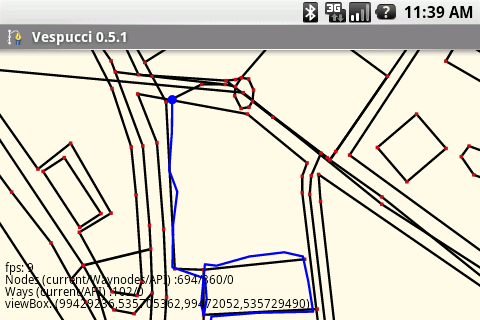
Screenshot showing a GPS track with the underlying OSM data.
Moving the map
You can move the map around when you are in move mode by dragging the map around. There are zoom in and out buttons that allow you to change the zoom level. You can also use the pinch gesture to zoom in and out of the map.
Moving nodes
Push the Android Menu button and select Edit.
Nodes and ways are now highlighted.
You can move the nodes around by pressing a node to select it and then pulling it with your finger.
Editing tags
Push Menu button on your Android. Select Edit Tags.
Touch on a node.
You will now see a menu of nodes.
Select the node you want to edit.
You can now edit the Key and Value pairs of the node.
Enter a new Key and Value pair in the empty slots to add a new Key/Value.
When you are finished editing the values you can push Okay.
Creating new features
Press the Menu button and select New.
Pushing once on the map creates a point. You can then switch to edit tags mode and re-select that node to give it some properties
Pushing the map many times creates a way.
Ending a way by pushing on the starting point creates an area.
Appending ways
Press Menu button.
Select Append.
You are now able to continue an old way by adding new points to the way.
Deleting Nodes
Press the Menu button.
Select More.
Select Erase node.
Push on a node to delete it.
Saving your changes
Once you have made some changes to the data in the area you will want to share those with the rest of the OSM community.
Press the Menu button on your Android.
Select More, and then select Transfer.
Select Upload data to OSM server. You will be shown a list of the changes that you are about to upload and make live on the OSM server, and be asked to enter a comment about what the changes are. You then tap the upload button.
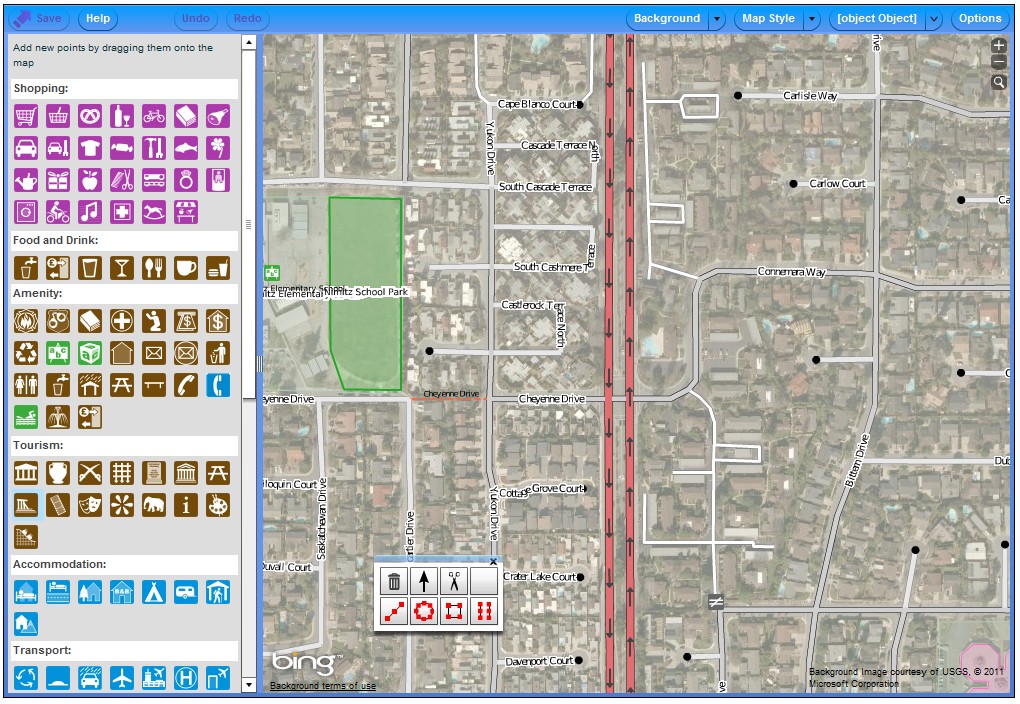
Now we can look at editing OpenStreetMap with the online editor Potlatch 2, which you can use in your browser, later we will look at the desktop editor JOSM that you can install on your computer, and the mobile phone editors Vespucci and Mapzen.
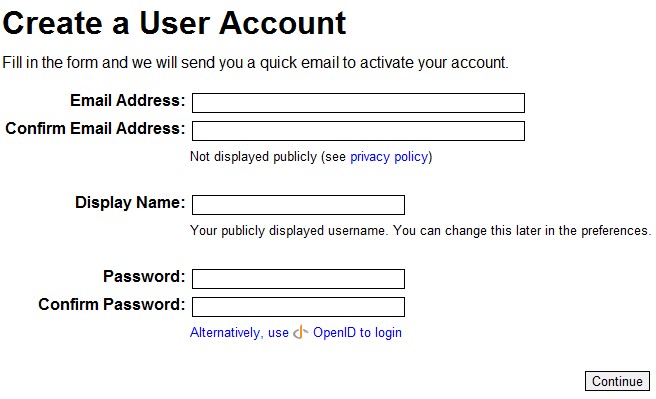
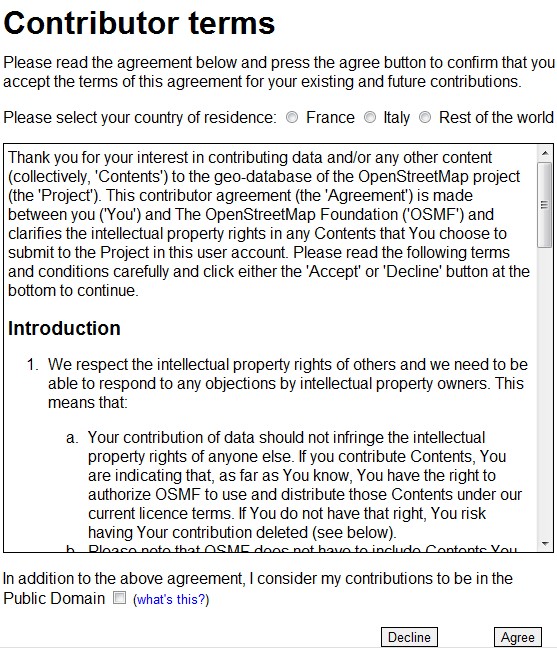
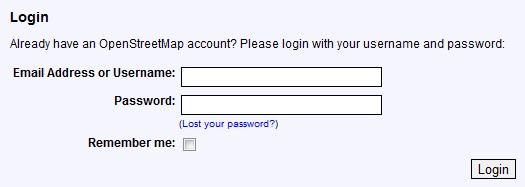
Potlatch 2 is an OpenStreetMap editor that allows you to make edits directly to the OpenStreetMap database. Before you begin editing, however, you must log into OpenStreetMap. If you don't already have an account, go to http://www.openstreetmap.org/ in your browser to create an account and log in.
Getting your hands on Potlatch 2
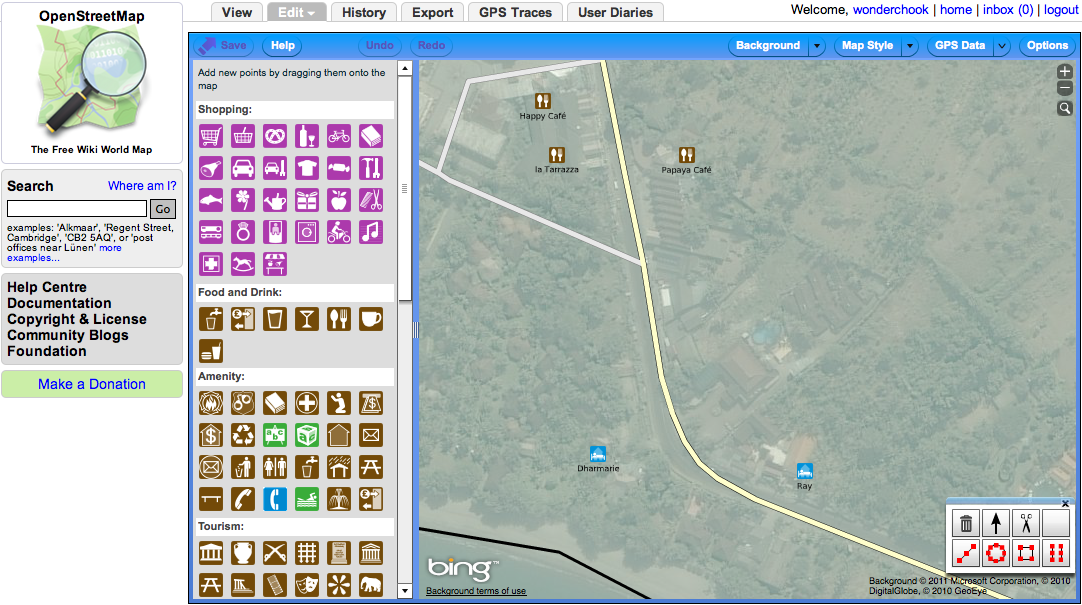
You should access Potlatch 2 through the OpenStreetMap web site first. Click Edit in the menu on the top of the OpenStreetMap web page. You should see the Potlatch 2 interface, like this:
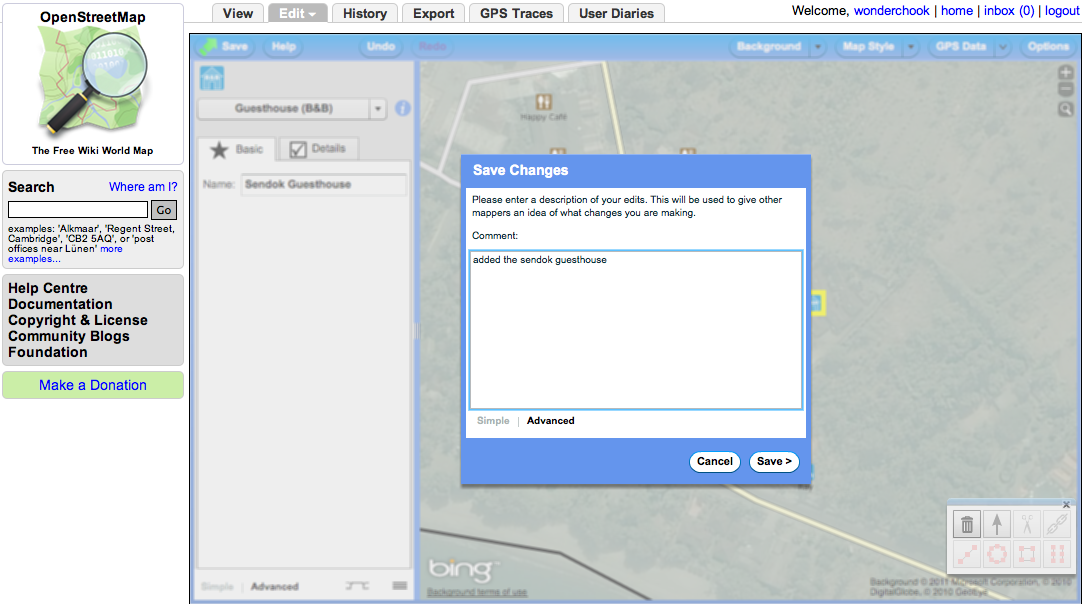
Saving your edits
In the top of the Potlatch 2 interface you see the most important button: Save. Remember to always click Save after your edits! Help will open a Help file, Undo will cancel your previous edit, and Redo will return the last edit you cancelled with the Undo button.
Moving around the OpenStreetMap
You can move around the map by holding down the left mouse button and moving your mouse.
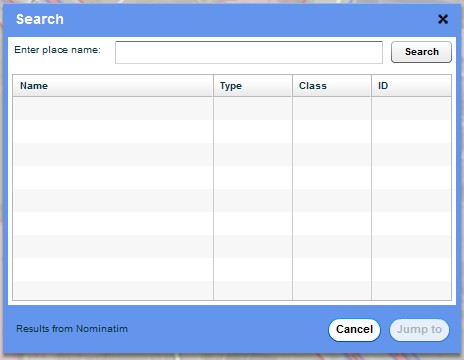
On the top right corner of the map you see three buttons. These are the zoom buttons and the search button. + increases and - decreases zoom level.
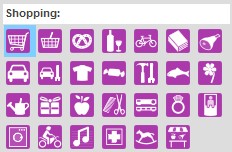
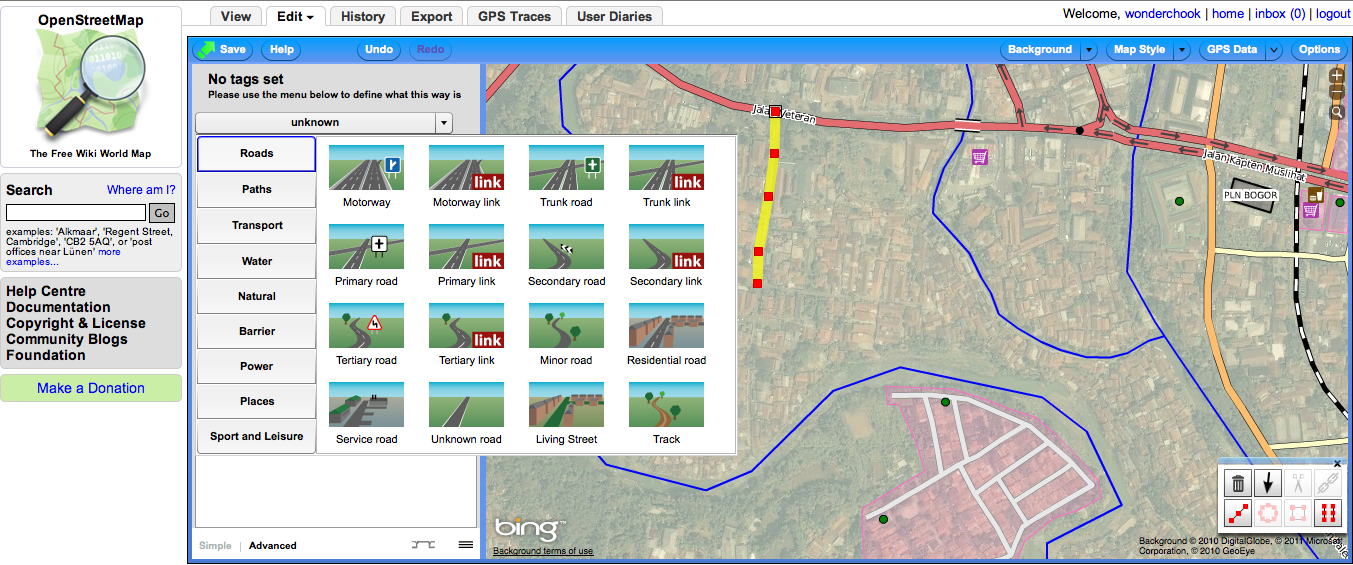
Adding points to OpenStreetMap
On the left side of the map you should see a list of different types of point you can add to the map.
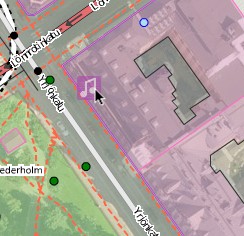
You can just click on a point type with the left mouse button and drag it to the right location on the map while holding down the mouse button.
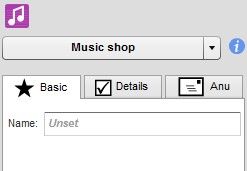
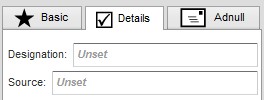
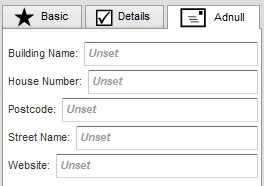
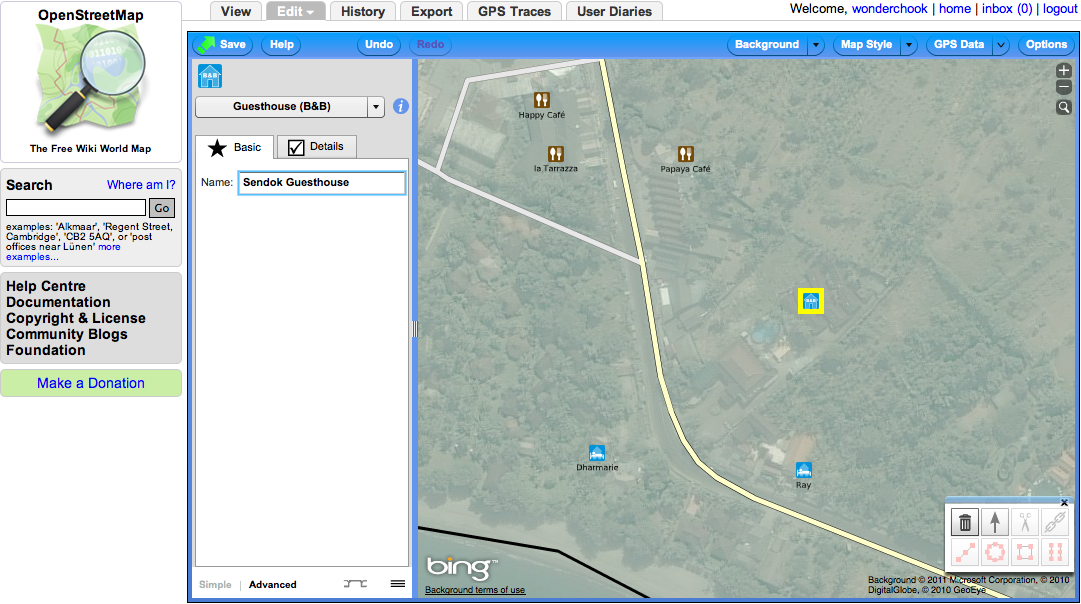
When you have placed it you will see that on the left side of the map there are now tabs with information for the feature.
Note that the tabs and the information contained will be different depending on the feature type you have selected. Some features have more tabs.
You can always edit this information by selecting the feature you want to edit.
Here we are looking at the Music shop tabs. In the Basic tab you can just add the name of the location.
Details tab contains various fields you can edit depending on the type of point you are adding.
Address tab is where you can edit address information for the point.
You can also create a point by clicking three times on the map.
Creating lines
Just clicking on the map allows you to create lines. Another click adds a new node. Double click ends the line.
Creating areas
To create an area, create a line by clicking as above, and make it a closed area by double clicking on the starting node when you're done.
Selecting a feature
Click on a feature on the map to select it for editing. The selected feature is highlighted.
You can select multiple features by holding down the CTRL key and clicking on features.
Moving points
To move nodes around, click on a feature to activate it. When the feature is highlighted, the nodes become visible.
Now you can click a node and drag to move a node around.
You can also click and drag on a line to move the entire feature around!
Editing toolbox
You should see a toolbox which you can move around on top of the interface:
This allows you to edit the features on the map. The following table explains what the buttons do.
Delete
Deletes the selected feature.
Reverse direction
Reverses the direction of the selected feature.
Split way
Splits a way feature into two parts.
Merge ways
Merges ways when you have selected two ways that end in the same node.
Straighten way
Straightens the selected way straight between two or more nodes.
Make circular
Makes a selected area circular.
Make right-angled
Turns the area you have selected into a right-angled area.
Create parallel way
Creates a way parallel to your selection.
Searching maps
Below the zoom buttons you should see a magnifying glass button. This is for map search. Click it to find a location on the map. A search box opens.
Enter the place name you are looking for and click Search. This will return a list of locations that match the place name you are searching for.
Select the location you want to edit and click Jump to.
Potlatch 2 options
The menu on the top right of the Potlatch 2 interface contains the following buttons:
Clicking Background opens a menu which allows you to change the background image of the OpenStreetMap.
Clicking Map Style allows you to change the style of the displayed map.
Clicking Options allows you to change several options about how OpenStreetMap looks.
Anybody can edit data in OpenStreetMap. This chapter will give you the concepts you need to understand in order to begin contributing.
OpenStreetMap consists of a few basic types of data: nodes, ways, relations, and tags.
A node is a single point with a latitude and longitude. A single node can be a point of interest such as a tree or a mailbox or a place such as a city of a village.
A way is a line. Lines are made by connecting many nodes together. A way can be something like a road or a trail.
An area is a way where the starting and ending point are the same. Note that not all closed ways are always areas. There might be a circular road for an example, which would be a closed way but not an area. A lake, on the other hand, would be an area. Other words for an area include a shape or a polygon. Other examples of an area include a building, a sports field, or a forest.
Relations are used to group geographically-related objects together. Relations are perhaps harder to understand than the previous concepts, but you are also less likely to need them when starting on your path (or way!) as a OpenStreetMap contributor. Relations could be used to group something like the roads of a bus route together. So in the bus route example instead of drawing a new set of ways to describe the bus route you can say which roads are part of the bus route using a relation.
A tag is a key/value pair that is used to describe an object. The key tells you what kind of object it is, for example an amenity or a highway. You then use the value to describe what type of object it is, for example an amenity might be a bank or a pharmacy, while a highway might be a primary road or residential street. There are many tags already use in OpenStreetMap, but there is flexibility to create new ones in case you want to map something nobody else has mapped before. This versatility means you can add any keys and values that you think are needed. Many editors however have presets for common key/value pairs, which makes it easier and faster to edit maps.
Changesets are sets of edits within OpenStreetMap. When you edit OpenStreetMap the changes you make during that editing session are saved in a changeset. This changeset is seen in history tab of the map, and are associated with your user account.
Fives of the OSM sprinters, Anne Gentle missing, and the clock, marking the end of the sprint
You are reading the first free and open book about OpenStreetMap, the open and editable map created and refined by world wide contributors.
This book is dedicated to newcomers interested in collaborative mapping who have not yet gotten their hands on OpenStreetMap. Though we wanted to make this book accessible for beginners, advanced users will also find more complex information in the last two sections.
It was written during a three-day book sprint held during the Google Summer of Code Documentation Summit in Mountain View, California between the 18th and 20th of October 2011. The team consisted of a group of six co-authors (developers, users, trainers and beginners), Kate Chapman, Ian Dees, Anne Gentle, Shaun McDonald, Nóirín Plunkett and Tomi Toivio, and was facilitated by Anne Goldenberg of FlossManuals-fr.
This book was written with several goals in mind:
To welcome you to the practice of collaborative mapping.
To introduce you the OpenStreetMap contributing community.
To explain to you the basics of OpenStreetMap contribution.
To present to you the tools, the tricks and the more advanced uses of OpenStreetMap.
To offer you free and updated documentation that can be edited by the community.
We hope you enjoy this book as much as we enjoyed collaborating on it. Don't hesitate to contribute to this text online if you want to improve or update this documentation and collaborate with us. You will find everything you need at http://booki.flossmanuals.net/openstreetmap/. You are also welcome to help with the translation of this book at flossmanuals.net. And we are looking forward to welcoming you to the OpenStreetMap community, where we hope you will enjoy collaborating with us in future!
As we mentioned earlier, maps are an important and useful method of conveying spatial and visual information quickly and clearly. You can use maps in a variety of ways to help make decisions, to convey safety information, to efficiently move around a community, or to describe where to go and how to get there. Traditionally, this useful information is collected and maintained by organizations whose main motivation and interest is in making money from the maps. But often, the use of these maps is restricted, and in cases where it's not profitable to create or maintain them, good maps may not even exist. OpenStreetMap was created to fill these voids: it is an open, freely-editable, wiki-style map of the world.
For many people, participating in OpenStreetMap is about having fun while creating data that others can use freely. Contributing to OpenStreetMap is a great way to explore a town you've never visited before, a reason for learning more about somewhere you're familiar with, and a means to becoming deeply knowledgable about places you care about, using data collection as an excuse for all these activities! Additionally, collecting map data on foot or bicycle is a great way to maintain physical fitness and an excellent reason to be active outdoors.
Here are some use-cases we want to share to spark ideas about how map data might become useful to you or members of your community.
Cyclists looking for the best routes and sharing bikes
Your bike is tuned up and you're ready to go. Data from OpenStreetMap lets you plan the best journey: cycle-friendly, safe, quiet or quick, flat or hilly, calorie burning and eco-friendly!
CycleStreets (www.cyclestreets.net) is a website and a smartphone app that was created using OpenStreetMap data for the United Kingdom. Maps are designed specifically for cyclists by cyclists, including details like bike parking and bike shops on a route, as well as cycleways that link roads that aren't obvious on other maps. You can choose the quietest route if you're biking for leisure or wanting a safe route for children. The fastest route is for confident cyclists, but still provides turn-by-turn directions. Or you can find something in the middle, a balance between a quiet, wandering route and the trickier passageways that might require more cycling skill like multiple lane-changes or tight corners. Then you can print a map, or use your smart phone to guide you.
BikeShare is a website that uses OpenStreetMap data to enable people to pick up bikes, use them for a time period, and drop them off for other service subscribers to use. The site works for many locations: for example, the Minneapolis site is at http://bikes.oobrien.com/?city=minneapolis and shows bike docks and whether there are bikes in a particular dock site.
By overlaying map information with bike locations, the site gives people access to bikes when and where they need them. Cool!
Communities seeking stability, safety, and infrastructure
Maps with free data can provide specific information that's relevant in the local context. Whether it's about improving access to water or creating understandable traffic routes in large informal settlements, free map data furthers humanitarian efforts and economic stability in underdeveloped areas.
Without the map information it is nearly impossible to understand the living conditions and housing structures where people are living in large slums. For example, in 2009, a project started to create the first publicly available map of Kibera. Kibera is one of Africa's largest slums, with an estimated 200,000 residents, yet conditions were essentially invisible to outsiders due to a lack of mapping. There was almost no information available about things like sanitation, water availability, traffic patterns, and housing structures. How could something so large be so unknown? By sharing map tools with the residents and enabling them to share their knowledge with others, OpenStreetMap gave a visual to insiders and outsiders alike.
Haiti's disastrous earthquake in the early weeks of 2010 left many Haitians setting up undocumented encampments after their community buildings, roads, and houses were completely destroyed. It also led to a collaboration of hundreds of "armchair mappers", who found a way to help using post-quake aerial imagery. Crisis responders who set up relief efforts used the OpenStreetMap data for their reports to various agencies to enable quick response.
Access to health and medical facilities, clean drinking water, and transportation information could all be located on a map, to help crisis responders provide assistance to those who needed it most. Lack of sanitation and water access make refugee camps and and ad hoc settlements extremely vulnerable to disease problems, but freely-available map data helps the responders reverse the unhealthy living conditions these camps can suffer from.
Rural students learning high-tech techniques
"How well do you know your neighborhood?" the teacher in Red Bank, Tennessee asked seven high school students who had no previous experience in mapping or using Geographic Information Systems (GIS) experience. Through the discussion, they learned that they didn't know the spelling of O'Reilly (or was it O'Reilly's?), an auto parts store down the road, or the exact location of Shoney's (or was it Shoneys?), a restaurant on the other side of their small town. The group was instantly engaged and interested in the idea of creating detailed maps of their home town.
One student worked diligently to map all the soccer fields in his town. Another who appreciated art and green spaces focused on the parks and trees to highlight the beautiful areas in her hometown. One teacher noted that high school students also enjoyed marking buildings (including each other's houses) as pubs or brothels - which had to be immediately corrected, of course, before the teachers could get "in trouble" or have their teaching skills brought into question in this conservative area! The results were accurate, green, and quite detailed, even showing each curve of the high school track, and clearly labeling the marching band's rectangular field.
Word of mouth made the course a popular one, and the following year, thirty students signed up. One high school student even taught elementary students how to draw maps of their area, including the principal's parking spot! Fully half the students at this high school receive support such as free lunches, so the teachers and school must meet the basic needs in life, as well as providing the technology access that isn't available at home. OpenStreetMap provides an energy and a liveliness in bringing science and technology to life in schools, connecting students to the rest of the world.
All of these aspects work together to build a community that generates and supports the best map data available on the Internet. We hope that you find OpenStreetMap to be useful and interesting in your work. By following this guide, you should be able to quickly start making digital maps and adding to OSM.
There are many different ways to add to OpenStreetMap, but a user account is required for all of them. In this chapter we will cover how to sign-up for an account and make your first edit.
To sign up for a user account, click Sign Up in the upper right corner of the page. If you have already created an account, click Log In and continue to the portion of this chapter entitled "Making Your First Edit".
You will see a Create a User Account form.
Enter your Email address twice. Note that your email address will only be used to contact you with OpenStreetMap-related information and will not be displayed publicly. Next you can enter the Display name you wish to be identified by. Finally, you need to enter your Password twice. Click Continue.
You will see the Contributor terms page:
You can select your country of residence, if available, to see the contributor terms in your language. Read the contributor terms and you can also release your contributions to the Public Domain by checking the check box for "In addition to the above agreement, I consider my contributions to be in the Public Domain". This checkbox is optional and for more information you can read about it on the OpenStreetMap Foundation wiki (http://www.osmfoundation.org/wiki/License/Why_would_I_want_my_contributions_to_be_public_domain).
Click Agree to continue with the registration process. Before you are allowed login you have to check your email account and follow the instructions in the confirmation email to enable your user account.
If you already have an account, you can click on the Log in link in the upper right corner of the page. You will be taken to the login page.
Enter your Email Address or Username and Password. Click Login. Now you are ready to make your first edit.
Making Your First Edit
By default, OpenStreetMap uses an editor we developed called Potlatch 2 to manipulate the data. Click Edit and the loading screen below will appear. Once the Potlatch 2 editor has loaded, you will be ready to make your first edit.
There are virtually limitless things that can be mapped in OpenStreetMap. This variety can be a bit daunting when first getting started! Good things to edit in your first session might include be restaurants, schools or any incorrect road information you see. There is a page in the OpenStreetMap wiki that can be a good place to get ideas for what to map (http://wiki.openstreetmap.org/wiki/Map_Features).
It's important when you're editing not to copy from copyrighted information. This includes other online maps such as Google Maps or Bing Maps. The information there is free to use, but the actual data is copyrighted and can't be copied. The easiest way to adhere to these rules is to use only your own personal knowledge and the resources available in the editors.
In this example we are going to add a guesthouse that is missing from the map. When the Potlatch 2 editor has loaded you will see the map information that already exists loaded in the right side of the window. Things you can add to the map will show up as icons on the left side. Click on the type of data you want to add and drag it to its proper position on the map on the right side of the browser window.
Since I am adding a guesthouse I click on the guesthouse icon. If the icon definition isn't clear to you, hover over it to display a bit of text that tells you what the icon is. Hovering over the guesthouse icon, the tool tip says "Guesthouse (B&B)".
Once you position the icon in the right place the list of icons on the left will change to prompts for additional information about the place you just added. In the case of the guesthouse there is a single textbox to add a name.
Once you have finished adding additional information to the feature that you've added it is important to save your work. This is how your changes get shared with the rest of the OpenStreetMap community. To do this, press the Save button and a "Save Changes" box will appear. Here you enter your comments about what you've changed or added to OpenStreetMap and then press Save. These comments are helpful to others in the community to understand your changes.
Another easy first edit is to add a road. One easy way to do that is to trace over the satellite imagery available from Bing Maps in the Potlatch 2 editor. To add a road that is connected to another road click on the road you want to connect it to in order to highlight it. Next click on the point for that road where you want to start your new road.
Note: if you can't click there, it means that you need to add a node to start the road. Push shift key and click on the road where you want to start the line. We will introduce the idea of a node in a later chapter.
Once you have clicked on your desired starting point you will see there is a line connected to your mouse cursor. For every bend you want to make in the line of your new road you need to click. When you are finished with your road double click in order to stop adding the road.
Now you need to define what type of road it is. On the left side of the editor it will say "No tags set".
Click on the drop down below that and then select "Roads." You can now choose the type of road you have added. In this example it is a "Residential Road."
After you have defined the type of road it is possible to add other information. A form will show that allows you to add the name of the road as well as additional speed limit and lane information. If the road is one-way it is also possible to add that.
As you can see it is easy to get started adding to OpenStreetMap using satellite imagery and your personal knowledge. Later on in the book you will learn how to map more types of information and how to actually go outside and collect information using GPS and paper maps called Walking Papers.
There are many different options for providing maps on your own web site. The most basic and easiest for you to use is a JavaScript library called OpenLayers that provides a draggable map that you can embed on your own webpage. This is similar to the earlier section in this book describing the "Export" tab on http://osm.org/. In this chapter we'll go farther by describing how to set up your own server with a customized map style based on OpenStreetMap data. You might want to do this if you are interested in highlighting a particular kind of OpenStreetMap data like bicycle or foot paths or if you are dissatisfied with the elements present in the other available map styles.
System requirements
Serving your own maps is a fairly intensive task. Depending on the size of the area you're interested in serving and the traffic you expect the system requirements will vary. In general, requirements will range from 10-20GB of storage, 4GB of memory, and a modern dual-core processor for a city-sized region to 300GB+ of fast storage, 24GB of memory, and a quad-core processor for the entire planet.
What are tiles?
For our purposes, a web map is made up of several adjacent square images, each 256 pixels square, that cover a particular geographic region of the Earth. The OpenLayers library we are using in this example will place these tiles in a grid to form a draggable view of anywhere on the Earth.
Using OpenLayers
OpenLayers is a JavaScript library for displaying maps on your web site. It is very powerful and can be used to add advanced features to your map like buttons, overlays, popup windows and lines. In this example we'll use it simply to show the map that you render, but to learn more about extending it to include these features, please visit http://openlayers.org/.
The toolchain
We use a series of tools for generating and serving map tiles:
Apache provides the front end server that handles requests from your web browser and passes the request to mod_tile. The Apache web server can also be used to serve static web content like the HTML, JavaScript, or CSS for your map webpage.
Once Apache handles the request from the web user, it passes the request to mod_tile to deal with. Mod_tile checks if the tile has already been created and is ready for use or whether it needs to be updated due to not being in the cache already. If it is already available and doesn't need to be rendered, then it immediately sends the tile back to the client. If it does need to be rendered, then it will add it to a "render request" queue, and when it gets to the top of the queue, a tile renderer will render it and send the tile back to the client.
We use a tool called Mapnik to render tiles. It pulls requests from the work queue as fast as possible, extracts data from various data sources according to the style information, and renders the tile. This tile is passed back to the client and moves on to the next item in the queue.
For rendering, OpenStreetMap data is stored in a PostgreSQL database created by a tool called osm2pgsql. These two pieces work together to allow efficient access to the OpenStreetMap geographic data. It is possible to keep the data in the PostgreSQL database up to date using a stream of diff files produced every 60 seconds on the main OpenStreetMap server.
Start with an installation of Ubuntu (10.04) Lucid Lynx Server for your hardware architecture. Add the LAMP server and SSH server during installation. Once installed, this can be run as a headless server with neither monitor nor keyboard. So ssh to the new box, and let's get started. Since there may be several updates for Lucid Lynx, update the packages on your system:
sudo apt-get update
sudo apt-get upgrade
Fetch some essential system tools for this tile server installation process:
Organize the file system to make the installation process a bit easier:
cd ~
mkdir src bin planet
Get the latest OpenStreetMap data
Retrieve a piece of OpenStreetMap data from http://planet.openstreetmap.org/. Since the whole planet is at least 18GB when compressed, there are links to smaller country or state sized extracts on that page. Since it is smaller and faster to interact with, the PBF file format is preferable when available. In this case we'll download the entire planet file by issuing the following command:
cd planet
wget http://planet.openstreetmap.org/planet-latest.osm.bz2
Install and configure PostgreSQL database
Next, we need to install the PostgreSQL database system. Start by using apt-get to install the database and required extensions:
The default configuration for PostgreSQL 8.4 needs to be tuned for the amount of data you are about to add to it. Edit the file /etc/postgresql/8.4/main/postgresql.conf and make the following changes:
It should restart without any errors and report back with this message:
 * Restarting PostgreSQL 8.4 database server
   ...done.
Create a database called gis. Some of our future tools presume that you will use this database name. Substitute your username for username in two places below. This should be the username that will render maps with Mapnik.
Give your newly-created user permission to access some of the PostGIS extensions' data. Make sure you replace username with your user's name:
echo "ALTER TABLE geometry_columns OWNER TO username; ALTER TABLE spatial_ref_sys OWNER TO username;" | psql -d gis
Load OpenStreetMap data into the database
We need to set up the tool that converts OSM data into the PostgreSQL data format. Start by checking out the latest source code and compiling it:
cd ~/bin
svn co http://svn.openstreetmap.org/applications/utils/export/osm2pgsql/
cd osm2pgsql
./autogen.sh
./configure
make
Once compiled, we need to set the spatial reference on the newly-created database:
psql -f ~/bin/osm2pgsql/900913.sql -d gis
With the conversion tool compiled and the database prepared, the following command will insert the OpenStreetMap data you downloaded earlier into the database. This step is very disk I/O intensive and will take roughly 30 hours depending on the speed of the computer performing the conversion and the size of the data you retrieved from the server.
Let's have a look at your data import as it progresses. The first part of the osm2pgsql output looks scary, but is normal:
Using projection SRS 900913 (Spherical Mercator)
Setting up table: planet_osm_point
NOTICE:  table "planet_osm_point" does not exist, skipping
NOTICE:  table "planet_osm_point_tmp" does not exist, skipping
Setting up table: planet_osm_line
NOTICE:  table "planet_osm_line" does not exist, skipping
NOTICE:  table "planet_osm_line_tmp" does not exist, skipping
Setting up table: planet_osm_polygon
NOTICE:  table "planet_osm_polygon" does not exist, skipping
NOTICE:  table "planet_osm_polygon_tmp" does not exist, skipping
Setting up table: planet_osm_roads
NOTICE:  table "planet_osm_roads" does not exist, skipping
NOTICE:  table "planet_osm_roads_tmp" does not exist, skipping
Mid: pgsql, scale=100, cache=4096MB, maxblocks=524289*8192
Setting up table: planet_osm_nodes
NOTICE:  table "planet_osm_nodes" does not exist, skipping
NOTICE:  CREATE TABLE / PRIMARY KEY will create implicit index "planet_osm_nodes_pkey" for table "planet_osm_nodes"
Setting up table: planet_osm_ways
NOTICE:  table "planet_osm_ways" does not exist, skipping
NOTICE:  CREATE TABLE / PRIMARY KEY will create implicit index "planet_osm_ways_pkey" for table "planet_osm_ways"
Setting up table: planet_osm_rels
NOTICE:  CREATE TABLE / PRIMARY KEY will create implicit index "planet_osm_rels_pkey" for table "planet_osm_rels"
Don't be concerned by the NOTICE: entries above. All normal. Next, osm2pgsql will start reading the compressed planet file.
Reading in file: /home/user/planet/planet-latest.osm.bz2
As osm2pgsql reads the planet file it will give progress reports. The line below will refresh every few seconds and update the numbers in brackets. This part of the import takes a long time. Depending on your server, it will take between hours and days.
Processing: Node(10140k) Way(0k) Relation(0k)
As the import proceeds, the Node number will update a couple of times per second until complete, then the Way number will update roughly every second or two. Finally, the Relation number will update at roughly once per minute. As long as you can see these numbers advancing the import process is still operating normally for your server. Do not interrupt the import process unless you have decided to start over again from the beginning.
Processing: Node(593072k) Way(45376k) Relation(87k)
Exception caught processing way id=110802
Exception caught processing way id=110803
Processing: Node(593072k) Way(45376k) Relation(474k)
The exceptions shown above are due to minor errors in the planet file. The planet import is still proceeding normally.
The next stage of the osm2pgsql planet import process also will take between hours and days, depending on your hardware. It begins like this:
Node stats: total(593072533), max(696096737)
Way stats: total(45376969), max(55410575)
Relation stats: total(484528), max(555276)

Going over pending ways
processing way (752k)
The processing way number should update approximately each second.
Going over pending relations

node cache: stored: 515463899(86.91%), storage efficiency: 96.01%, hit rate: 85.97%
Committing transaction for planet_osm_roads
Committing transaction for planet_osm_line
Committing transaction for planet_osm_polygon
Sorting data and creating indexes for planet_osm_line
Sorting data and creating indexes for planet_osm_roads
Sorting data and creating indexes for planet_osm_polygon
Committing transaction for planet_osm_point
Sorting data and creating indexes for planet_osm_point
Stopping table: planet_osm_nodes
Stopping table: planet_osm_ways
Stopping table: planet_osm_rels
Building index on table: planet_osm_rels
Stopped table: planet_osm_nodes
Building index on table: planet_osm_ways
Stopped table: planet_osm_rels
Completed planet_osm_point
Completed planet_osm_roads
Completed planet_osm_polygon
Completed planet_osm_line
Stopped table: planet_osm_ways
At this point the import is complete and successful.
Install Mapnik library
Next, we need to install the Mapnik library. Mapnik is used to render the OpenStreetMap data into the tiles used for an OpenLayers web map. To start, we'll install the dependencies for the Mapnik library followed by downloading and compiling the source:
cd ~/src
svn co http://svn.mapnik.org/tags/release-0.7.1/ mapnik
cd mapnik
python scons/scons.py configure INPUT_PLUGINS=all OPTIMIZATION=3 SYSTEM_FONTS=/usr/share/fonts/truetype/
python scons/scons.py
sudo python scons/scons.py install
sudo ldconfig
Verify that Mapnik has been installed correctly:
python
>>> import mapnik
>>>
If python replies with the second chevron prompt >>> and without errors, then Mapnik library was found by Python. Congratulations!
Install Mapnik tools
Next, we need to install the OpenStreetMap Mapnik tools, which include the default style file and tools to help Mapnik render OpenStreetMap data:
cd ~/bin
svn co http://svn.openstreetmap.org/applications/rendering/mapnik
Mapnik uses prepared files to generate coastlines and ocean areas for small scale maps since it is faster than reading the entire database for this information.
cd ~/bin/mapnik
mkdir world_boundaries
wget http://tile.openstreetmap.org/world_boundaries-spherical.tgz
tar xvzf world_boundaries-spherical.tgz
wget http://tile.openstreetmap.org/processed_p.tar.bz2
tar xvjf processed_p.tar.bz2 -C world_boundaries
wget http://tile.openstreetmap.org/shoreline_300.tar.bz2
tar xjf shoreline_300.tar.bz2 -C world_boundaries
wget http://www.naturalearthdata.com/http//www.naturalearthdata.com/download/10m/cultural/10m-populated-places.zip
unzip 10m-populated-places.zip -d world_boundaries
wget http://www.naturalearthdata.com/http//www.naturalearthdata.com/download/110m/cultural/110m-admin-0-boundary-lines.zip
unzip 110m-admin-0-boundary-lines.zip -d world_boundaries
The database is loaded and the tools are installed. Let's test everything together. Remember to replace username with your username.
cd ~/bin/mapnik
./generate_xml.py --dbname gis --user username --accept-none
./generate_image.py
View image.png to confirm that you have rendered a map of England. Congratulations!
Install and configure Apache web server and mod_tile
Now that we've created an image using your map data, we need to set up the tile serving software to handle tile requests using Apache. To do this, we'll install the Apache web server and use the mod_tile extension to handle the tile rendering system.
Begin by installing tools necessary to build mod_tile:
cd ~/src
svn co http://svn.openstreetmap.org/applications/utils/mod_tile
cd mod_tile
make
sudo make install
Change the the mod_tile settings by editing the /etc/renderd.conf and change the following lines like so (remember to change username to your user's name):
Also, Apache's default website configuration file needs to be modified to include mod_tile settings. Modify the file /etc/apache2/sites-available/default to include the following lines immediately after the admin e-mail address line:
LoadTileConfigFile /etc/renderd.conf
ModTileRenderdSocketName /tmp/osm-renderd
# Timeout before giving up for a tile to be rendered
ModTileRequestTimeout 0
# Timeout before giving up for a tile to be rendered that is otherwise missing
ModTileMissingRequestTimeout 30
You'll then need to start the mod_tile rendering application. Note that it will not output anything upon successful start.
cd ~/src/mod_tile
./renderd
Congratulations! You now have a server capable of generating tiles using your own copy of the OpenStreetMap data. Visit http://localhost/osm_tiles2/0/0/0.png to verify that you have a working map tile generated.
While you're making an effort to contribute some data to OpenSourceMap, you may also want to share the results of your efforts with others. If your data starts to form a interesting map, you may want to share with others. This chapter describes how you can offer your maps to other people or organizations.
First you must know that the openstreetmap.org website offers permanent, unchanging links to a location with longitude and latitude values, using a neat trick in the URL itself to tell the site what location you want it to display. These links are easy to retrieve on a map. On the openstreetmap.org site, just click Permalink or Shortlink in the lower right area of a map when you're on the View tab.
Creating Permalinks
When you click Permalink in a map, this action populates your browser address bar with the permalink URL, which you can then share with others by copying and pasting into emails, online forums, blog comments, and so on. You must be on the View tab to see the Permalink option.
Here's the anatomy of a Permalink with all the possible parameters you can use:
Location (lat and lon): Latitude and longitude are in lat and lon values, which are represented as mlat and mlon when you want to indicate a marker. You can enter up to six digits after the decimal point for these values.
Zoom: The zoom level is a value from 1, representing your map on the entire Earth, zoomed all the way out, to 18, which shows it a map within walking distance. To see your map or marker within a country, for example, try a zoom level of 6 or 8.
Layers: Layers are optional and the default is "Mapnik" or layers=M. Layers give you another "skin" on the map. You can use the default, or use O for an OpenStreetMap renderer, or use layers=C for a Cyclemap view.
Layers are handy when you want to find safe bicycling routes, for example. You can also click the plus symbol to see a list of the layers and choose another layer, which then appears in the Permalink in the browser address bar. The differences mostly show in the colors and fonts displayed on the map.
Creating Shortlinks
As you can see, the Permalink yields a rather long URL, since it contains all the data about the map you're viewing. If you prefer short URLs, you can right-click the Shortlink text in the lower right corner of the map and get the link through your browser's link properties or a Copy Link Location menu. Here is an example of a shortlink to Austin, Texas: http://osm.org/go/Ts0q_IBJ--.
If you double-click the map to center the where you want to highlight a location, your short link can go to a centered map with that marker icon in the middle if you add '?m' to the end of the URL. For example, this shortlink goes to the Austin Convention Center and has a marker at the corner of 4th and Trinity, http://osm.org/go/Ts0q7wU3?m.
These shortlinks are great for sending IMs or text messages, or using Twitter or Facebook for encouraging click-throughs to your map.
Embedding a map on a web page
If you want to have a map for directing people to the trailhead for a bike ride or the starting point for a pub crawl, for example, you may want to get HTML to embed in a page. People can then refer to your map on their smart phone, or print it from your site. You can easily get the code to embed a map on a web page from OpenStreetMap. Here's how:
On the View tab, find the address or location by zooming and dragging the map so that it looks the way you want it to.
Go to the Export tab and under the heading "Format to Export", choose "Embeddable HTML".
Optionally, add a marker to the map under Options by clicking "Add a marker to the map" and then double-clicking on the map to add the marker and center the map on that point.
Under "Output", copy the HTML code.
Paste the HTML code into the web page in which you want to embed the map.
The OpenStreetMap data model is a powerful yet simple way to represent geographic information. Understanding the data model enables you to interact with OpenStreetMap data in its raw form so that you can manipulate it into formats that are more useful for what you're trying to do. You'll want to understand the data model if you are interested in writing a map editor, converting the raw OpenStreetMap data into a format for use in an application, or if any of the existing software tools don't provide functionality that you want.
In traditional GIS the map data is represented in three different ways: a point is a single location in space defined by coordinates, a linestring is a linear feature representing a road or a border, and a polygon is an enclosed area. Data describing these geographical features is usually attached as an afterthought in a secondary database. In OpenStreetMap, these three concepts are distilled down into nodes, ways, and relations with tags being a way to describe each feature. This chapter discusses these core OpenStreetMap concepts in more detail.
This is an advanced topic that will help you if you decide to delve deeper into working with OpenStreetMap data, perhaps to implement something interesting that does not already exist, or improve a current tool. It will help you if the task requires low level control of map data, either when working with static datasets or interacting with an OpenStreetMap API, such as the live REST API used to edit the OSM data. To learn more about the REST API, visit the wiki page at http://wiki.openstreetmap.org/wiki/API_v0.6.
Tags
Tags are "key-value" pairs of strings optionally attached to each geographic element in OpenStreetMap. These tags describe the feature they are attached to, and can be any pair of strings up to a maximum of 255 characters in length (including spaces), with the only restriction that keys be unique inside one element. If there are no tags associated with a feature, most renderings of the data won't display that feature.
Nodes
Points on Earth are called nodes and are represented by a latitude, longitude and as many tags as may be appropriate. For example, nodes are used to represent shops, bus stops, benches, and post boxes. A node without any tags will always be a subelement of another element.
Ways
An ordered list of nodes is called a way. A way has a maximum of 2000 nodes to ensure that tools and users are not overwhelmed with very large structures that are difficult to manipulate. They are used for representing linear features like footpaths, roads, rail lines, and power lines.
Areas do not have a specific data type, and are simply a kind of closed way where the first node is the same as the last node. They are used to represent building outlines, parks, and landuse.
Relations
Relations are ordered lists of nodes, ways or relations. Each member of a relation has an optional role that gives an additional piece of information about that subelement. These roles are strings up to 255 characters long, like tag values. Relations can represent road or bicycle routes, turn restrictions, and administrative boundaries, again depending on the set of tags attached.
You should remember that relations are not categories and should not be used solely to group things together. You should probably use a tag to group things together instead. For more information about this topic, visit http://wiki.osm.org/wiki/Relations/Relations_are_not_Categories.
Identifiers
Any element in an OpenStreetMap dataset, of any of the three types above, is identified by a unique numerical id. These numbers have no other purpose than to allow referencing of individual features, and have no special meaning. A relation or a way uses these identifiers to reference its subelements. Two ways are said to meet only if they reference the same node identifier, rather than two nodes with identical coordinates. Closed ways representing areas need to reference the same node Id twice.
OpenStreetMap file formats
OpenStreetMap data files are traditionally distributed in an XML format representing the node, way, and relation concepts using a simple schema. Without compression, this XML format can be extremely large, so it is usually distributed using an efficient compression algorithm like gzip or bz2. Most of the tools designed to work with the OSM XML data format can also handle the compressed XML.
To solve the size and XML parse speed problem of XML, a separate format using Google's Protocol Buffers project was created to pack as much OSM data into a binary file as possible. The PBF format allows the data to be compressed even further than gzip and bz2 and allows much faster processing than compressed XML. There are libraries for several languages to help read this file format.
This book has been inspired by existing documentation, and among them, some very good blogs and websites. We also highly recommand you get in contact with members of the OpenStreetMap community, to get some support, inspiration, solutions and ideas.
Blogs and wikis
http://www.learnosm.org/ provides a simple-to-use, step by step approach to learning how to make maps with OpenStreetMap. We used content from this fine reference for chapters in this book.
http://egsc.usgs.gov/isb/pubs/gis_poster/ is a poster provided by the United States Geological Survey that is useful for the background and history of Geographic Information Systems and examples of GIS technology in use.
http://blog.osmfoundation.org/ is the blog for the OpenStreetMap Foundation, the non-profit organization based in the United Kingdom that supports the OpenStreetMap Project.
http://blogs.openstreetmap.org/ collects blog entries from multiple community members and displays journal entries from OpenStreetMap users.
http://hot.openstreetmap.org/weblog/ is the blog of the Humanitarian OpenStreetMap Team, a group within OpenStreetMap that uses the data in OpenStreetMap to assist in disaster response.
http://help.openstreetmap.org/ provides a Q&A forum, specifically for asking and answering questions related to OpenStreetMap.
http://forum.openstreetmap.org/ is a general discussion forum for OpenStreetMap. It requires registration and is somewhat less active than the mailing lists.
IRC channel for OpenStreetMap is #osm on oftc.net. There are other IRC channels available for different languages and topics. You can see a list of all different IRC channels in http://wiki.openstreetmap.org/wiki/IRC.
See the previous chapter on "Exploring the OpenStreetMap Community for more information about these resources.
OpenStreetMap: Using and Enhancing the Free Map of the World by Frederik Ramm, Jochen Topf and Steve Chilton (September 1, 2010): http://openstreetmap.info/.
http://wiki.openstreetmap.org/wiki/Develop has information about developing various things around the OSM ecosystem. There is a lot of information on the OSM wiki and various other sites.