


How to run Reports in Mifos Business Intelligence Suite (Pentaho)
Installing Mifos Business Intelligence Suite
Download Mifos Business Intelligence Suite and follow instructions for installation for either Windows servers or Linux servers.
Accessing Mifos Business Intelligence Suite Reports
Once Mifos Business Intelligence is installed, follow these instructions to select and run reports:
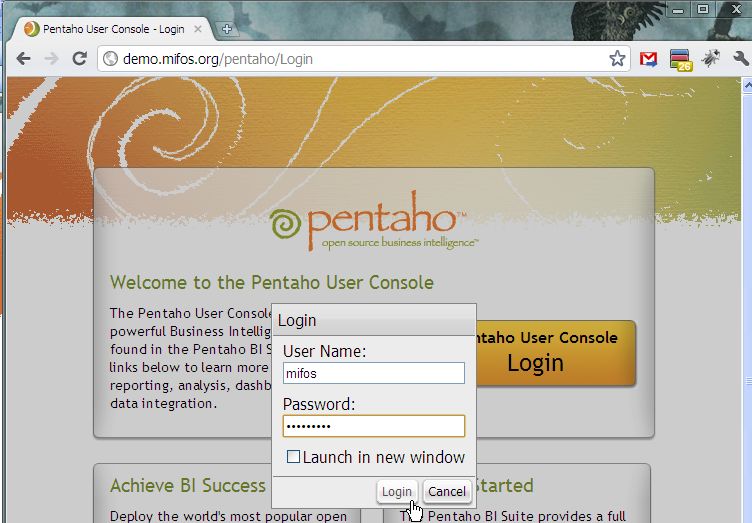
- Log in to your instance of Mifos Business Intelligence Suite in your internet browser.
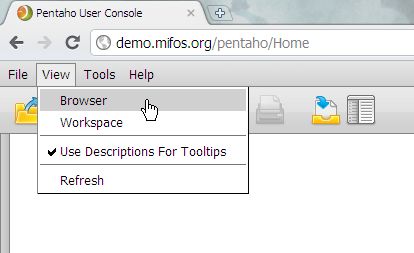
- Switch to the Browser View to access a folder hierarchy listing of reports (this will not displayed the first time you log in).
- Select the Standard Reports folder and list of the available standard reports will be displayed.

- Double-click the title of a report and new tab will open in the Pentaho window. You are able to load and view multiple reports at once.
Selecting Values for Parameters of Each Report
Each report has a different number of parameters which can be selected to filter the data displayed in the report. These filters and parameters were created when building the original report and can only be customized through the Pentaho Report Designer.
- Filters: these parameters correspond to different fields in Mifos. Some drop-downs will be dynamically populated based on the chosen value for the previous drop-down.
-
- To not filter the data based on a parameter, leave the value set as ALL or Any.
- Note: if your data set is large, for some reports when you leave the parameter at ALL or Any, the report will take a while to generate because of the large amount of data.
- Dates: Date values can be entered freehand or selected via the Calendar picker.
-
- For reports that provide a snapshot overview of data at a point-in-time, you can select a date via the As On Date field.
- For reports that compare or show data over a range of time, you select the date range via fields stating Start Date and End Date or in some cases From Date and To Date
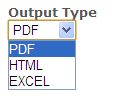
- Output Type: Reports can be generated in three formats - PDF, Excel, or HTML.
We will go through several reports to show an example of creating a report in each of the different formats.
Generating a Report in PDF format
PDF format is good when you simply need to view the data of the report or share it with an external audience and do no further data manipulation.
This example will show how to generate a PDF of the Balance Outstanding by Source of Funds report, showing balance outstanding and other figures per source of funds in Mifos.
- Double-click the Balance Outstanding by Source of Funds from lefthand folder repository.
- For Office, select which office to run the report for, I've chosen office-2.
- For Source of Funds, select which Source of Funds to sort the report by. In this example, I've left it all.
- Choose date in As On Date. I've left it as today - 2011-05-09.
- For Output Type, select PDF.

- Click Run Report.
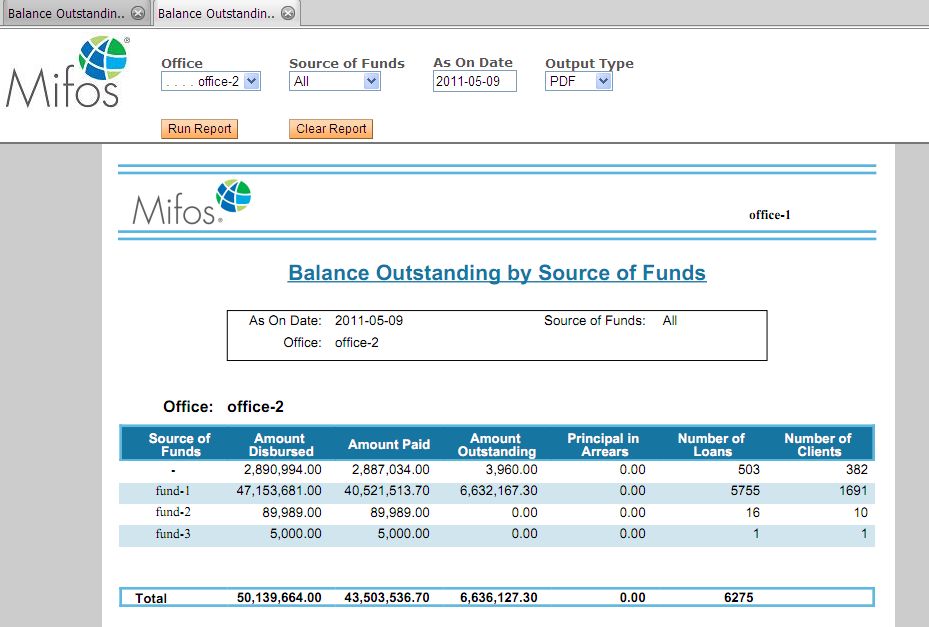
PDF will be generated in the same tab. Pressing Clear Report will clear out the report and allow you to generate it once more with different parameters in the same tab.
*Note: When attempting to save the report, some browsers like Chrome might not display the full Adobe Reader toolbar and you may need to right-click the report itself to bring up the "Save As" option.
Generating a Report in Excel format
Running a report in Excel format is good for sets of data that you need to sort, manipulate, or analyze further.
This example will show to how generate an Excel spreadsheet of the Mifos Transactions - Detail Report, a report can be run at the end of day to display all transactions made in Mifos that day. This report shows each detailed transaction. This report is useful for reconciliation with accounting and a good example of a report to be generated in Excel.
This report displays every transaction in Mifos; if a small date range or applicable filters or not selected, it can be a very lengthy report.
- Double-click Mifos Transactions - Detail from lefthand folder repository.
- Select a date range to display the transactions. I will select a small time frame, choosing 2010-03-02 for the From Date and 2010-03-05 for the To Date.
- For Branch Office, I selected office-2.
- Based on my Branch Office selection, the Personnel field will be populated with staff from office-2. I chose user-10 for this example.
- For Transaction Type, I can select a single value for any type of transaction processed by Mifos or I can leave it ALL. For this example, I selected ALL.
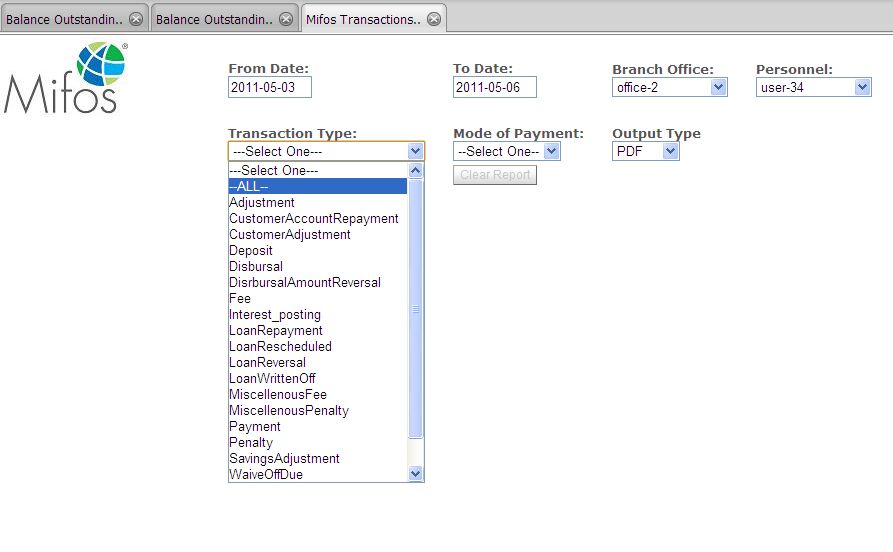
- For Mode of Payment, I can choose from Cash, Cheque, Voucher (whatever the payment types are that you've configured in Mifos). I selected Cash.
- Choose EXCEL for Output Type.
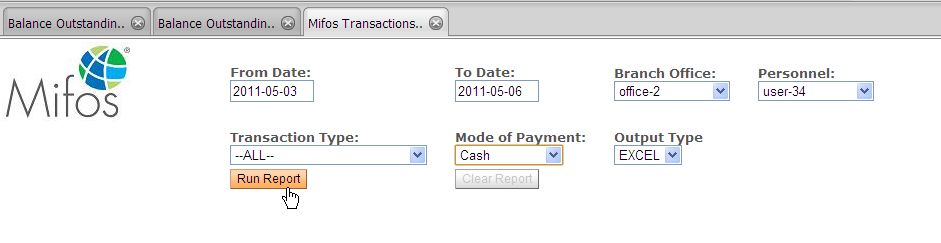
- Click Run Report.
Generating a Report in HTML format
Running a report in HTML format is good for viewing or embedding the report in another web page or web application.
This example will show how to generate an HTML version of the MFI Progress report which shows a comparison of 2 months specified by the user of the MFI's metrics, arrears, loan balances, etc. This report is useful in providing information on progress at the MFI - for example, if they are expanding their outreach at a certain pace, or if their PAR has increased or decreased.
- Double-click MFI Progress from lefthand folder repository.
- For Office, I selected office-2.
- Select two months for comparison. For Month 1, I chose Mar 2011. For Month 2, I chose April 2011.
- Choose HTML for Output Type.
- Click Run Report.