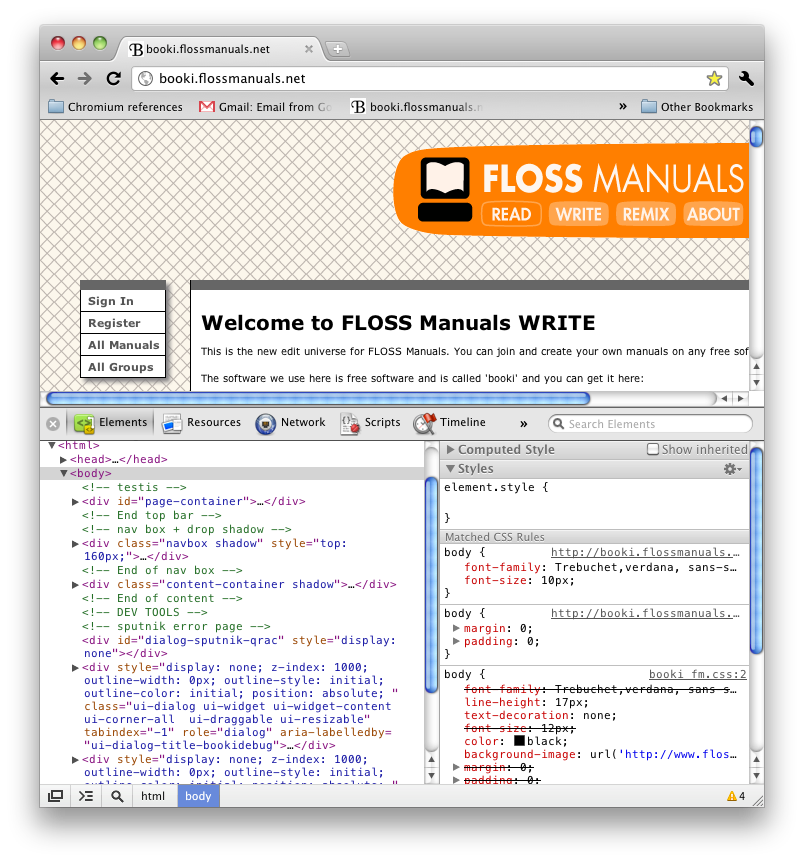
Using Chromium's Developer Tools
Chromium's Developer Tools allow website developers to debug (correct coding errors). Once you determine the problem, you can go to the source file and edit a web page's code to correct the problem.
Developer Tools also monitor the amount of time it takes for each element on a web page to load, which is useful to gauge a website's level of performance, and which allows developers to edit code in order to increase a website's loading speed.
To access the Developer Tools, click on the Wrench icon, select Tools, then click on Developer Tools.

To learn more about Chromium's Developer Tools, watch the introductory videos to Google Chrome's Developer Tools at http://bit.ly/7b4Mdk, and visit Chrome's Developer Tools mini-site at http://code.google.com/chrome/devtools/.


